

Assessing Risk and its Implications for Experimental Design - Part 2/4
In Part 2 of the experimental design series, we delve into types of errors in experiments, and strategies for identifying risks associated with the design.

👋 Hey! This is Manisha Arora from PrepVector. Welcome to the Tech Growth Series, a newsletter that aims to bridge the gap between academic knowledge and practical aspects of data science. My goal is to simplify complicated data concepts, share my perspectives on the latest trends, and share my learnings from building and leading data teams.
In the previous blog post on the big questions around experimental design, we talked about the importance of thinking through different aspects of an experiment.
This will give us the tools to decide how long an experiment should last and how much confidence we should give to the experimental results. Today we will be talking about this second point.
Often, we use results from an experiment to make a decision. For example, whether to roll out a pilot marketing campaign world wide, or start using a test ML model in multiple places on your website.
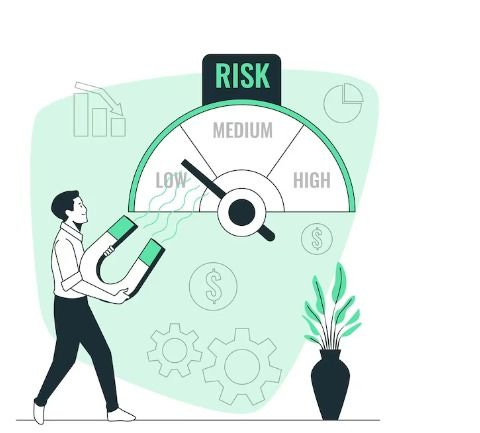
Understanding Risk in Experimental Design:
Since data is always noisy, there is always some risk, however miniscule, that the results from an experiment are driven by noise. Using experiments means we embrace that risk and think through how much risk we are willing to take on depending on the situation.
Here are two extreme examples:
1. When the risk of launching is high:
You are working on a start-up’s first marketing campaign. Your scrappy and dedicated team wants to experiment with two campaigns to launch to decide which to launch worldwide. One is a historically proven campaign strategy in the industry, and the other is an expensive out-of-the-box approach that would potentially grant huge yields if it is successful. The first campaign for a start-up is pivotal to its future success. Given the out-of-the-box approach is more expensive and could potentially fall through, the risks of launching it are large.
2. When the risk of not launching is high:
You are working at an established company selling breakfast foods. A rival company’s new cereal product is starting to dominate the cereal part of the breakfast foods market, and your team decides to run new marketing around its cereals. You are running an experiment to see whether this marketing campaign would regain control of the cereal part of the breakfast food market. In this case, the cost of being wrong is low because the cereal market is a small part of the breakfast foods market.
Based on these examples, we would say it is relatively more risky for a start-up to put all its bets on a moon-shot project, compared to a more established company. Risk should be based on your key metrics. If your experiment is trying to impact customer churn, for example, you want to think through how much of your customer base you are willing to risk based on the decision you will make based on the experiment.
How big False Positive or False Negative errors are varies from one context to another (see examples above). But once we know how big the risks are, we need to decide how likely we are willing to make these wrong decisions.
Errors in Experimental Design:
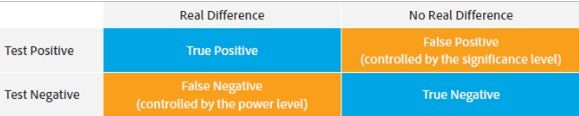
From a statistics (frequentist) perspective, we can describe these two risks from making the wrong decision as False Positive Errors and False Negative Errors, respectively.
Let us understand each of these errors.
- A False Positive Error is when you conclude not to launch treatment, but you should have.
A Type I error means rejecting the null hypothesis when it’s actually true. It means concluding that results are statistically significant when, in reality, they came about purely by chance or because of unrelated factors.
The risk of committing this error is the significance level (alpha or α) you choose. That’s a value that you set at the beginning of your study to assess the statistical probability of obtaining your results (p value).

- A False Negative Error is when you conclude to launch but you should not have.
A Type II error means not rejecting the null hypothesis when it’s actually false. This is not quite the same as “accepting” the null hypothesis, because hypothesis testing can only tell you whether to reject the null hypothesis.
Instead, a Type II error means failing to conclude there was an effect when there actually was. In reality, your study may not have had enough statistical power to detect an effect of a certain size.
Power is the extent to which a test can correctly detect a real effect when there is one. A power level of 80% or higher is usually considered acceptable.
The risk of a Type II error is inversely related to the statistical power of a study. The higher the statistical power, the lower the probability of making a Type II error.

Trade-off between Errors:
Type 1 & Type II errors influence each other. It’s important to strike a balance between the risks of making Type I and Type II errors.
Setting a lower significance level (alpha) decreases a Type I error, but increases Type II error.
Increasing the power of a test decreases Type II error risk (beta), but increases Type I error.
This trade-off is visualized in the graph below. It shows two curves:
The null hypothesis distribution shows all possible results you’d obtain if the null hypothesis is true. The correct conclusion for any point on this distribution means not rejecting the null hypothesis.
The alternative hypothesis distribution shows all possible results you’d obtain if the alternative hypothesis is true. The correct conclusion for any point on this distribution means rejecting the null hypothesis.
Type I and Type II errors occur where these two distributions overlap. The blue shaded area represents alpha, the Type I error rate, and the green shaded area represents beta, the Type II error rate.

Shameless plugs:
Master Product Sense and AB Testing, and learn to use statistical methods to drive product growth. I focus on inculcating a problem-solving mindset, and application of data-driven strategies, including A/B Testing, ML, and Causal Inference, to drive product growth.
What are acceptable values for errors:
How big False Positive or False Negative errors are varies from one context to another (see examples above). But once we know how big the risks are, we need to decide how likely we are willing to make these wrong decisions
Yes, there is always a chance that you make a wrong decision because noise in your data may have you draw the wrong conclusion. Deciding how likely you are to make these wrong decisions in the experiment reflects how risk averse you are. The higher the rate, the more risk-loving you are.
The lower these errors are for the experiment, the higher confidence we will need from our experiment to have us decide to launch. There are established rules of thumb for False Positive and False Negative Error rates:
False Negative Rates are 20%: this means that 20% of the time when treatment and control are different, we will incorrectly conclude that they are the same
False Positive Rates are 5%: this means that 5% of the time when the treatment and control are no different, we will incorrectly conclude from the experiment they are different.
Today we showed how to translate the business risks of making decisions into statistical concepts: the False Positive Rate and False Negative Rate. Determining these rates when we design our experiment forces us to think through how much risk we are willing to take on when we make the decision.
These risks are unavoidable because our data are noisy. But there are strategies we can use to remove some noise from our data before we thinking through the risk. Our next blog post will cover how to reduce the noise in your data and make more precise decisions.
If you liked this newsletter, check out my upcoming courses:
Master Product Sense and AB Testing, and learn to use statistical methods to drive product growth. I focus on inculcating a problem-solving mindset, and application of data-driven strategies, including A/B Testing, ML and Causal Inference, to drive product growth.
AI/ML Projects for Data Professionals
Gain hands-on experience and build a portfolio of industry AI/ML projects. Scope ML Projects, get stakeholder buy-in, and execute the workflow from data exploration to model deployment. You will learn to use coding best practices to solve end-to-end AI/ML Projects to showcase to the employer or clients.
Machine Learning Engineering Bootcamp
Learn the intricacies of designing and implementing robust machine learning systems. This course covers essential topics such as ML architecture, data pipeline engineering, model serving, and monitoring. Gain practical skills in deploying scalable ML solutions and optimizing performance, ensuring your models are production-ready and resilient in real-world environments.
Not sure which course aligns with your goals? Send me a message on LinkedIn with your background and aspirations, and I'll help you find the best fit for your journey.