

Explain Like I am 5 | Day 31: Closing the Loop with A/B Testing
Explain Like I’m Five Series | Lesson 31: Closing the Loop with A/B Testing | One core experimentation concept, explained with clarity and practical intuition.

In the series “Explain like I’m 5” we are breaking down the concepts of A/B testing that can be easily understood by even a 5-year-old.
👋 Hey! This is Manisha Arora from PrepVector. Welcome to the Tech Growth Series, a newsletter that aims to bridge the gap between academic knowledge and practical aspects of data science. My goal is to simplify complicated data concepts, share my perspectives on the latest trends, and share my learnings from building and leading data teams.
On day 1 we started this series with a cookie example. Let’s understand the “Closing the loop with A/B Testing” with a similar example.
Okay, imagine you have two kinds of cookies
Cookie A has chocolate chips. Cookie B has sprinkles. You want to know which one your friends like more.
So, you give Cookie A to some friends and Cookie B to other friends, and you watch which one gets eaten faster. That’s the test!
But here’s the thing just knowing “sprinkles won” isn’t enough. You need to do more:
Before the test, guess why sprinkles might win, not just that they will. Maybe because they’re colorful?
During the test make sure enough friends tried both cookies, and don’t change the recipe in the middle!
After the test don’t just say “sprinkles win forever!” Give sprinkle cookies to ALL your friends and check if they still like them just as much a few weeks later.
Learn. For the next time, write down “friends liked sprinkles because they’re colorful.” Now when you make your next cookie, you already know something important.
Most people just pick the winning cookie and walk away. “Closing the loop” means doing all four steps so every cookie test makes you a little smarter about what your friends actually like.
In A/B Testing terms
What Does “Closing the Loop” Even Mean?
You’ve probably run an A/B test before. You split your traffic, waited a few weeks, saw that Variant B had a higher click-through rate, declared victory, shipped Variant B, and moved on.
But did you actually close the loop?
Closing the loop means completing the full cycle of an A/B test — not just picking a winner, but learning why it won, feeding that learning back into your next hypothesis, and verifying that the win held up in production. Most teams stop at “ship the winner.” Closing the loop is everything that comes after, and before that moment.
The Loop, Broken Down
Think of A/B testing not as a one-time event but as a cycle with five stages:
1. Hypothesis -> 2. Experiment -> 3. Decision -> 4. Shipment -> 5. Validation -> back to 1
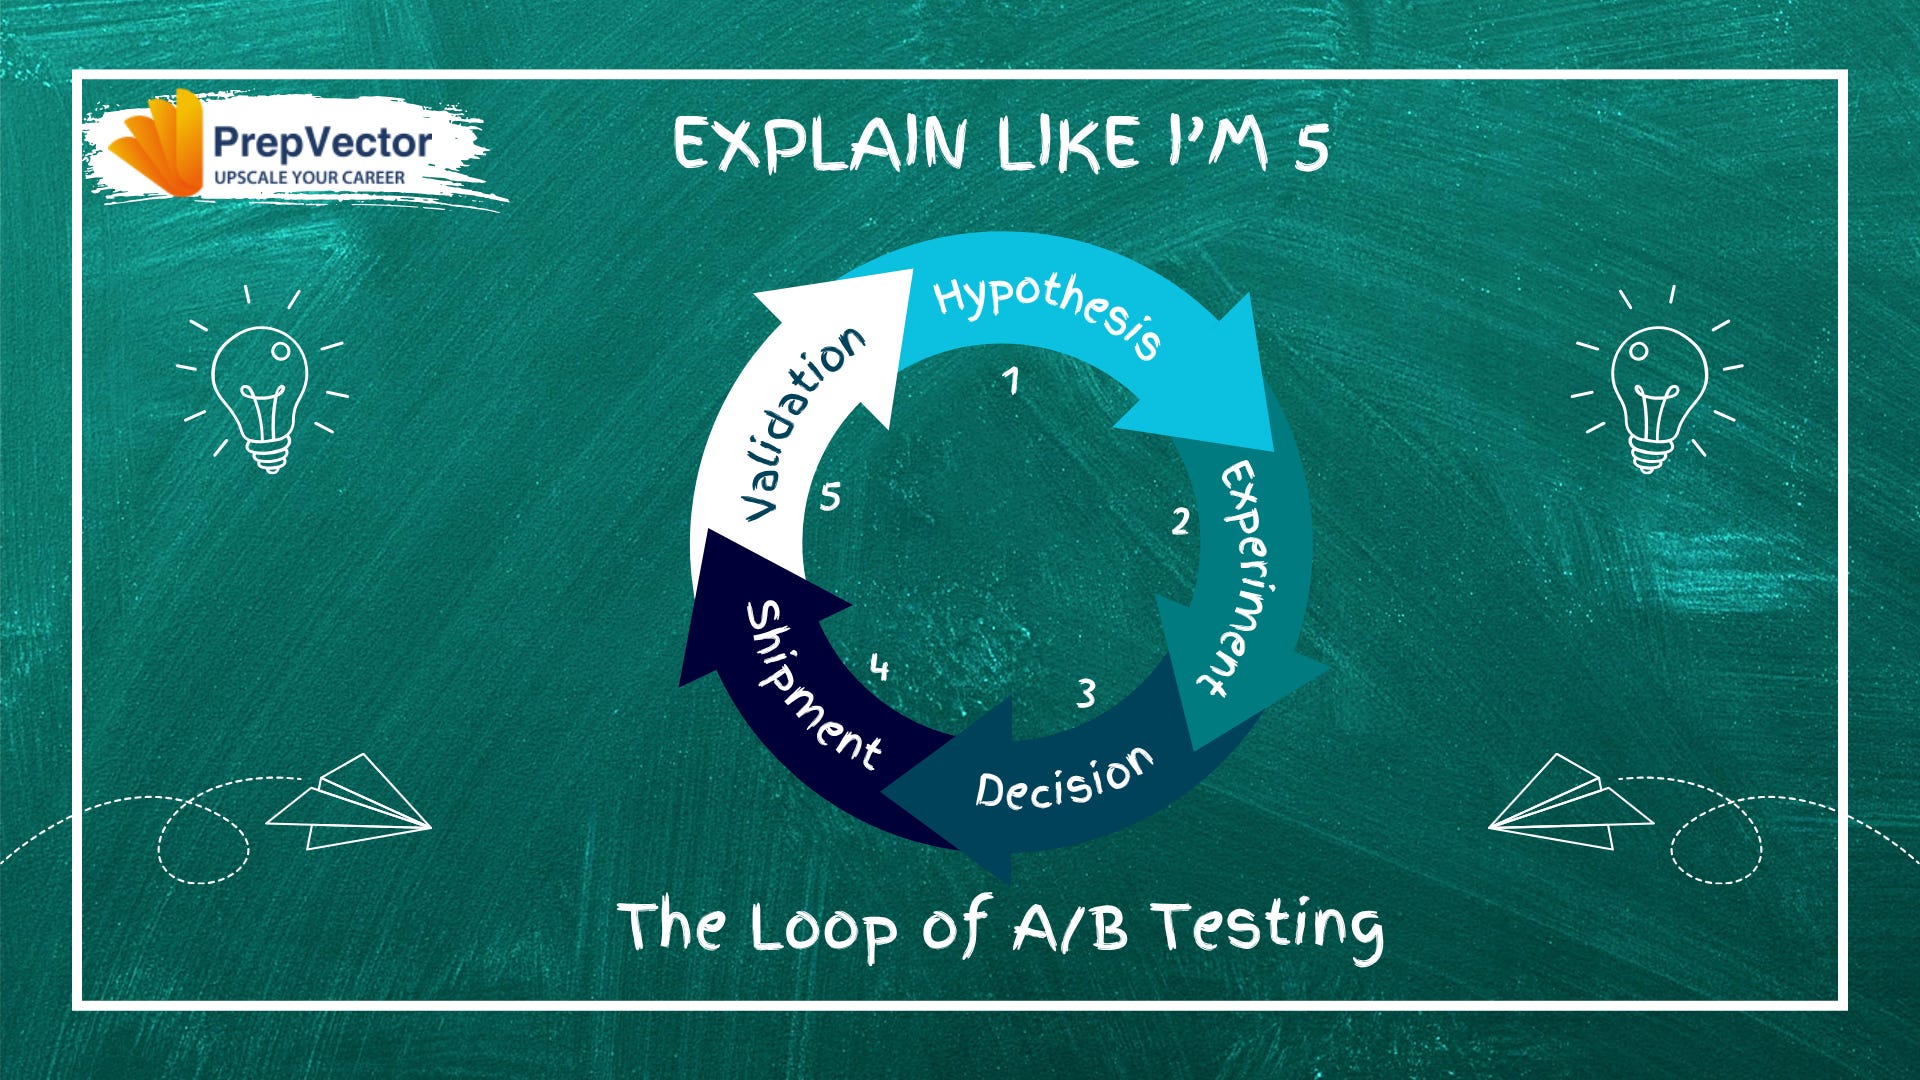
Most teams nail stages 1–3. They fumble stages 4 and 5. And they almost never complete the journey back to stage 1 intentionally.
Stage 1: Hypothesis
A good hypothesis isn’t “let’s try a red button.” It’s a causal statement:
“We believe that changing the CTA copy from ‘Submit’ to ‘Get My Free Report’ will increase form completions because users respond better to value-framing than action-framing.”
This structure: observation -> proposed change -> expected outcome -> reason is what makes closing the loop possible. Without a stated reason, you can’t learn anything even if the test wins. You just got lucky, and you don’t know why.
Technically: Log your hypothesis formally before the test begins. Tools like Optimizely, LaunchDarkly, or even a shared Notion doc work. The point is that the “why” is documented before results are seen, so you can’t retroactively rationalize outcomes.
Stage 2: Experiment Design
This is where most statistical mistakes happen that prevent loop closure later.
Sample size matters more than test duration. Run a power analysis before you start. If your baseline conversion rate is 3% and you want to detect a 10% relative lift (to 3.3%), you need roughly 50,000 users per variant. Running for “two weeks” without hitting that number gives you noise, not signal.
One variable at a time. If you change the button color and the copy and move it below the fold, you can’t close the loop you don’t know what caused the result.
Guard against novelty effect. Users sometimes respond to change itself, not your specific change. A test that runs for only 3 days might catch early adopters reacting to something new. Run long enough to include full weekly cycles.
Technically: Pre-register your primary metric (the one metric that decides win/loss), your secondary metrics (guardrails, did anything else break?), and your minimum detectable effect. Changing these after peeking at data is called p-hacking, and it destroys loop integrity.
Stage 3: The Decision
Your test ended. Now what?
First, check statistical significance but don’t worship it. A p-value of 0.05 means there’s a 5% chance you’re seeing a false positive. Run hundreds of tests and you’ll get plenty of false wins. This is why:
Practical significance matters too. A 0.2% lift that’s statistically significant might not be worth the engineering cost to ship.
Check your guardrail metrics. Did your winning variant improve sign-ups but tank session length? Did revenue go up but support tickets also spike?
Segment your results. Did the variant win across all user segments, or did mobile users hate it while desktop users loved it? Shipping a “winner” that only works for 60% of your users is a partial loss.
Technically: Use a decision framework, not just a p-value threshold. Something like: primary metric significant and no guardrail metric degraded more than X% and sample size reached AND test ran for at least Y days.
Stage 4: Shipping the Winner and the Gap Nobody Talks About
You ship Variant B to 100% of users. The test environment and the production environment are not the same thing. In the test, Variant B was shown to, say, 50% of traffic under controlled conditions. At 100%, a few things change:
Holdback testing: Keep 5 to 10% of users on the control after shipping. This lets you measure the real-world impact of the change against a live baseline, not a test baseline.
Ramp-up: Ship to 10% first, watch your metrics for 48 hours, then ramp to 50%, then 100%. Catch regressions before they hit everyone.
Feature flags: Ship the code but control exposure via a flag. This decouples deployment from release and lets you roll back in seconds without a new deployment.
Technically: Your experiment platform and your feature flag system should be connected. When a test concludes, the winning variant’s configuration should flow directly into your flag system with no manual re-implementation, which introduces bugs and invalidates your test results.
Stage 5: Post-Ship Validation
After shipping, measure the same metric you tested, but now in production, over the next 2–4 weeks, against your holdback group or against pre-ship baselines.
Ask these questions:
Did the lift hold? A/B test said +8% conversion. Are you actually seeing +8% in production? If not, why not? Was the test sample not representative? Did something else change at ship time?
Did it sustain? Some wins decay. Users adapt. The novelty fades. The “red button” that got 15% more clicks in week one might be ignored by week six.
What did you learn about your users? Even if the test was lost, why did it lose? A failed hypothesis, properly analyzed, is more valuable than a win you can’t explain.
Technically: Build a post-ship dashboard that tracks your primary metric from the test and compares it week-over-week post-ship. Set an alert if the metric reverts to baseline — that’s a signal your “win” didn’t survive contact with reality.
Back to Stage 1: Feeding Learnings Forward
Closing the loop means your learnings from Stage 5 explicitly inform your next hypothesis in Stage 1.
Most teams store test results in a spreadsheet graveyard. Nobody reads it. The next PM who joins has no idea that “simplified checkout” was tested three times and lost twice before finally winning.
Build a living experiment log with:
The hypothesis and stated reason
The result (win/loss/inconclusive)
The explanation of why you think it happened
The follow-up question it generated
When your next test’s hypothesis references a previous test’s learning, you’ve closed the loop. You’re not just running experiments, you’re building institutional knowledge about how your users think.
Conclusion
Closing the loop with A/B testing means:
Writing hypotheses with reasons, not just predictions
Designing experiments that can actually answer your question
Making decisions on evidence, not just p-values
Verifying that what worked in a test also works in production
Feeding what you learned back into the next question
Most teams treat A/B testing like a vending machine, put in a variant, get out a result. Closing the loop means treating it like a scientific process, where every test makes your next test smarter.
That’s the difference between a team that runs experiments and a team that learns from them.
If you’d like to dive deeper into experimentation, here are a few of our learning programs you might enjoy:
A/B Testing Course for Data Scientists and Product Managers
Learn how top product data scientists frame hypotheses, pick the right metrics, and turn A/B test results into product decisions. This course combines product thinking, experimentation design, and storytelling—skills that set apart analysts who influence roadmaps.
Advanced A/B Testing for Data Scientists
Master the experimentation frameworks used by leading tech teams. Learn to design powerful tests, analyze results with statistical rigor, and translate insights into product growth. A hands-on program for data scientists ready to influence strategy through experimentation.
Master Product Sense and AB Testing and learn to use statistical methods to drive product growth. I focus on inculcating a problem-solving mindset, and application of data-driven strategies, including A/B Testing, ML, and Causal Inference, to drive product growth.
Not sure which course aligns with your goals? Send me a message on LinkedIn with your background and aspirations, and I’ll help you find the best fit for your journey.