

Choosing the Right Causal Inference Method
A practical guide for data scientists on mapping real-world business problems to the right causal inference framework — from experiments to observational methods.

👋 Hey! This is Manisha Arora from PrepVector. Welcome to the Tech Growth Series, a newsletter that aims to bridge the gap between academic knowledge and practical aspects of data science. My goal is to simplify complicated data concepts, share my perspectives on the latest trends, and share my learnings from building and leading data teams.
In tech platforms and marketplaces, understanding what actually causes changes in user or partner behavior is critical. Correlations alone aren’t enough — causal inference allows you to rigorously measure the impact of interventions, whether that’s a new feature, a pricing change, or a policy rollout.
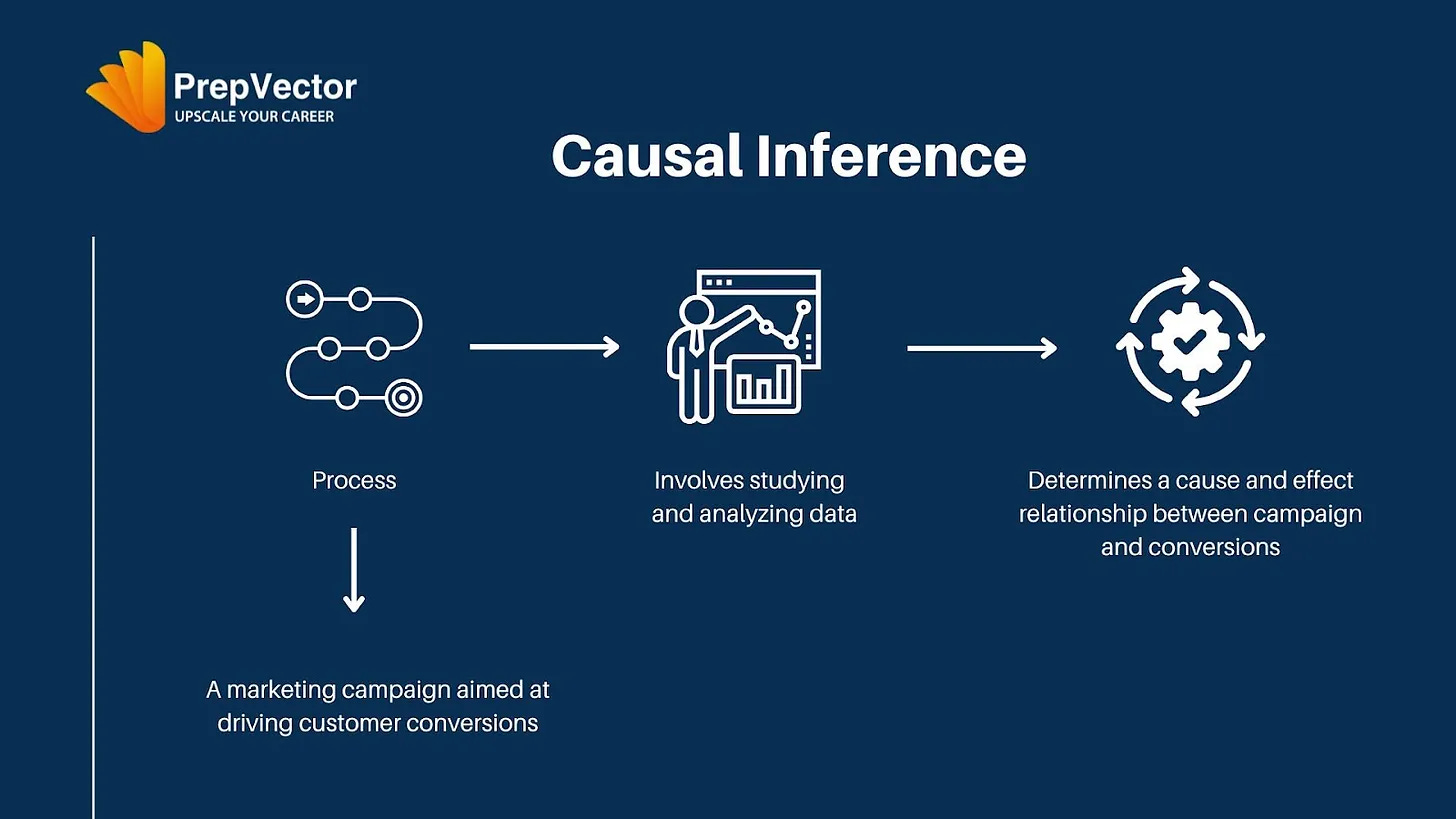
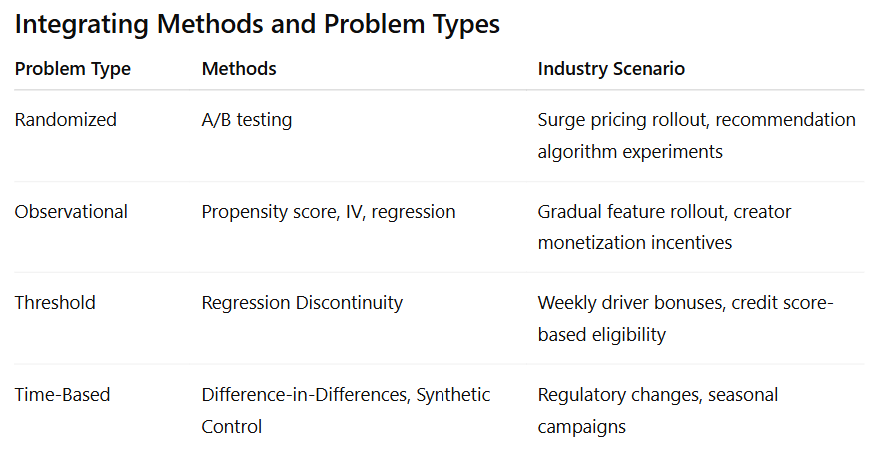
This guide walks through four major types of causal problems, the methods used to solve them, and realistic tech-industry scenarios that show how theory applies in practice.
Check out this blog for an introduction to causal inference, and moving beyond correlations.
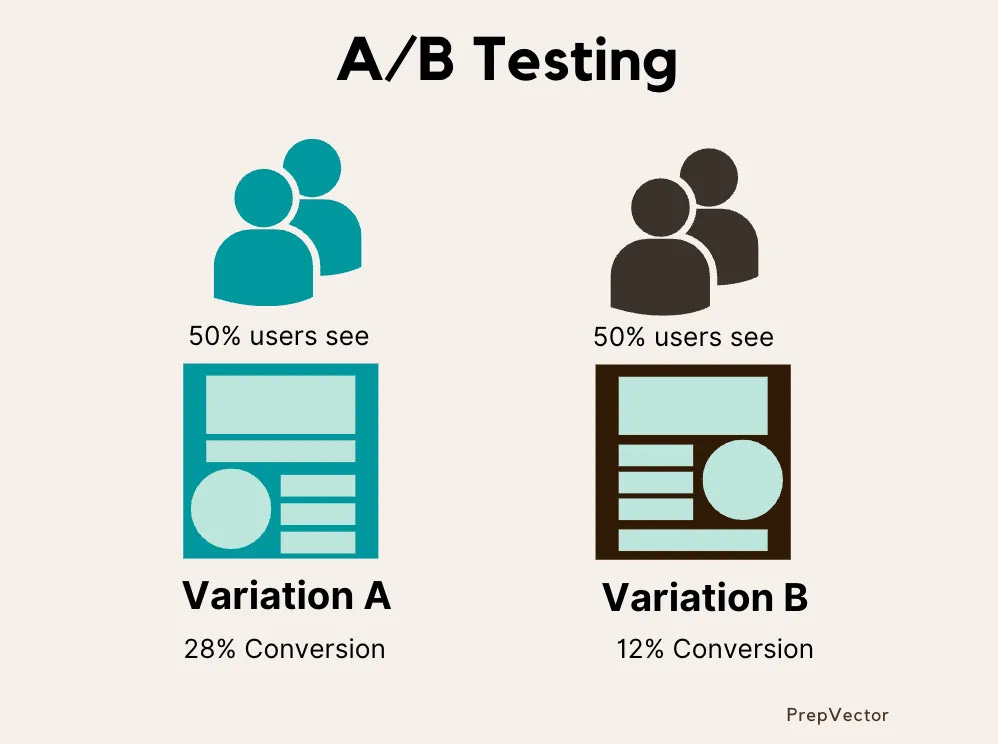
1. Randomized Problems: The Gold Standard
Randomized problems occur when treatment is assigned completely at random, such as assigning a new feature or pricing change to a subset of users, drivers, or regions. Randomization ensures that treatment and control groups are statistically equivalent, isolating the effect of the intervention.
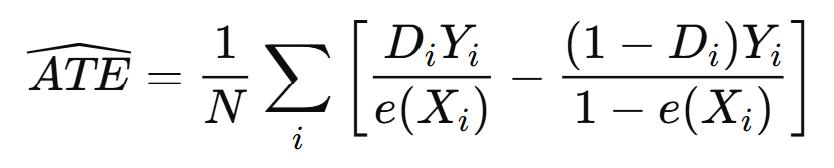
The causal effect is measured by the Average Treatment Effect (ATE):
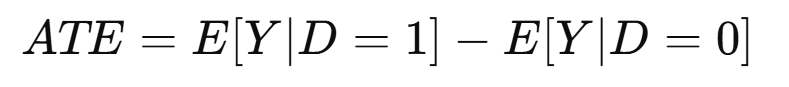
Where Y is the outcome of interest (e.g., engagement, revenue, or conversion) and DDD indicates treatment assignment.
Industry Scenario:
Suppose a ride-sharing platform wants to test a new surge pricing algorithm in a set of cities. Ten cities are randomly selected to receive the new pricing model, while others continue with the existing logic. By comparing ride requests, wait times, and driver earnings between the treatment and control cities over several weeks, the team can measure the causal impact of the pricing change.
Similarly, a streaming platform like Netflix may roll out a new recommendation algorithm to a randomly chosen subset of users. By comparing engagement metrics such as viewing time, content completion rates, and churn between the treated and control groups, the team can assess whether the new algorithm improves overall user experience.
2. Observational Problems: Working with Real-World Data
Many interventions cannot be randomized. Users may self-select features, or new functionality may be gradually rolled out. In these observational problems, treatment assignment is correlated with other variables, creating confounding.
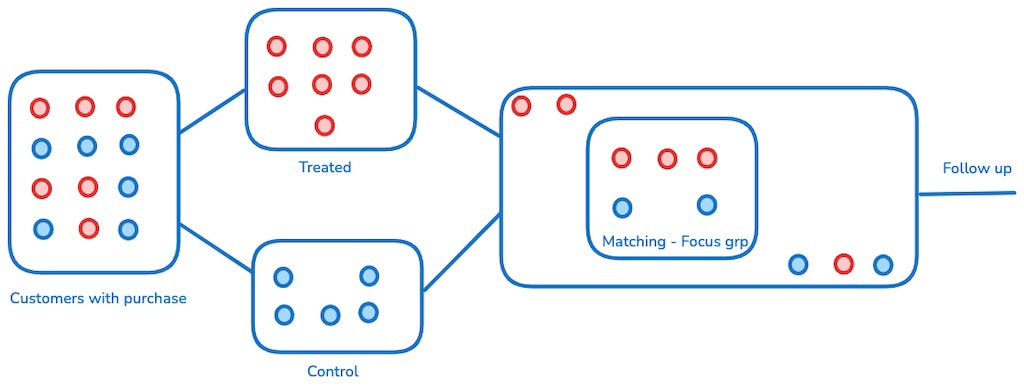
Methods like propensity score weighting/matching and instrumental variables (IV) help estimate causal effects.
Propensity scores estimate the probability that a unit receives treatment given observed characteristics:
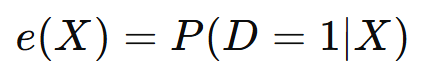
A weighted estimator can then adjust for confounding:
Industry Scenario:
An e-commerce platform wants to measure the effect of a new personalized recommendation feature. Because the feature is gradually rolled out, early-adopting users may differ in engagement or demographics from later adopters. Propensity score weighting can adjust for these differences, estimating the true impact of recommendations on purchases or session time.
Another example is a social media platform evaluating a new creator monetization incentive. Creators may self-select to participate based on past engagement or follower count. Using IV methods (e.g., assignment based on random quota limits) or regression adjustments helps isolate the causal effect of the incentive on content production and audience engagement.
Check out this detailed guide to Propensity Score Matching along with industry case study.
3. Threshold-Based Problems: Regression Discontinuity
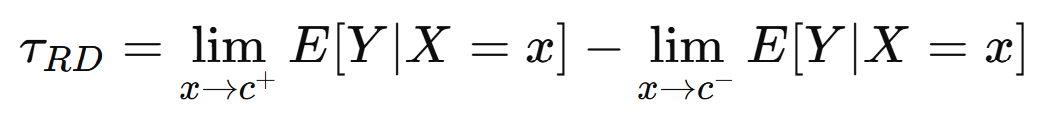
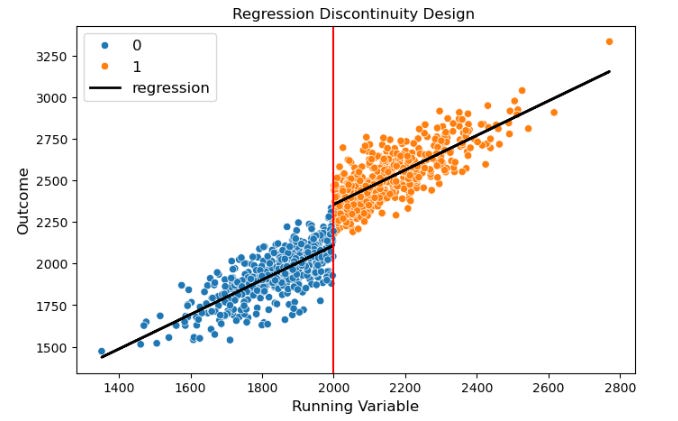
Threshold-based problems occur when treatment is assigned according to a cutoff, such as bonus eligibility, loyalty tiers, or eligibility scores. Regression Discontinuity (RD) leverages the cutoff to estimate a local causal effect, comparing units just above and below the threshold:
Industry Scenario:
Consider a ride-sharing platform offering a weekly driver bonus for completing at least 10 trips. RD analysis compares drivers completing 10 trips with those completing 9, estimating how the bonus affects incremental trips, engagement, and earnings.
On a fintech platform, credit limits may increase for users with scores above 700. RD allows the platform to measure the effect of higher limits on spending, repayment behavior, or product adoption, comparing users just above and just below the threshold.
4. Time-Based Problems: Difference-in-Differences & Synthetic Control
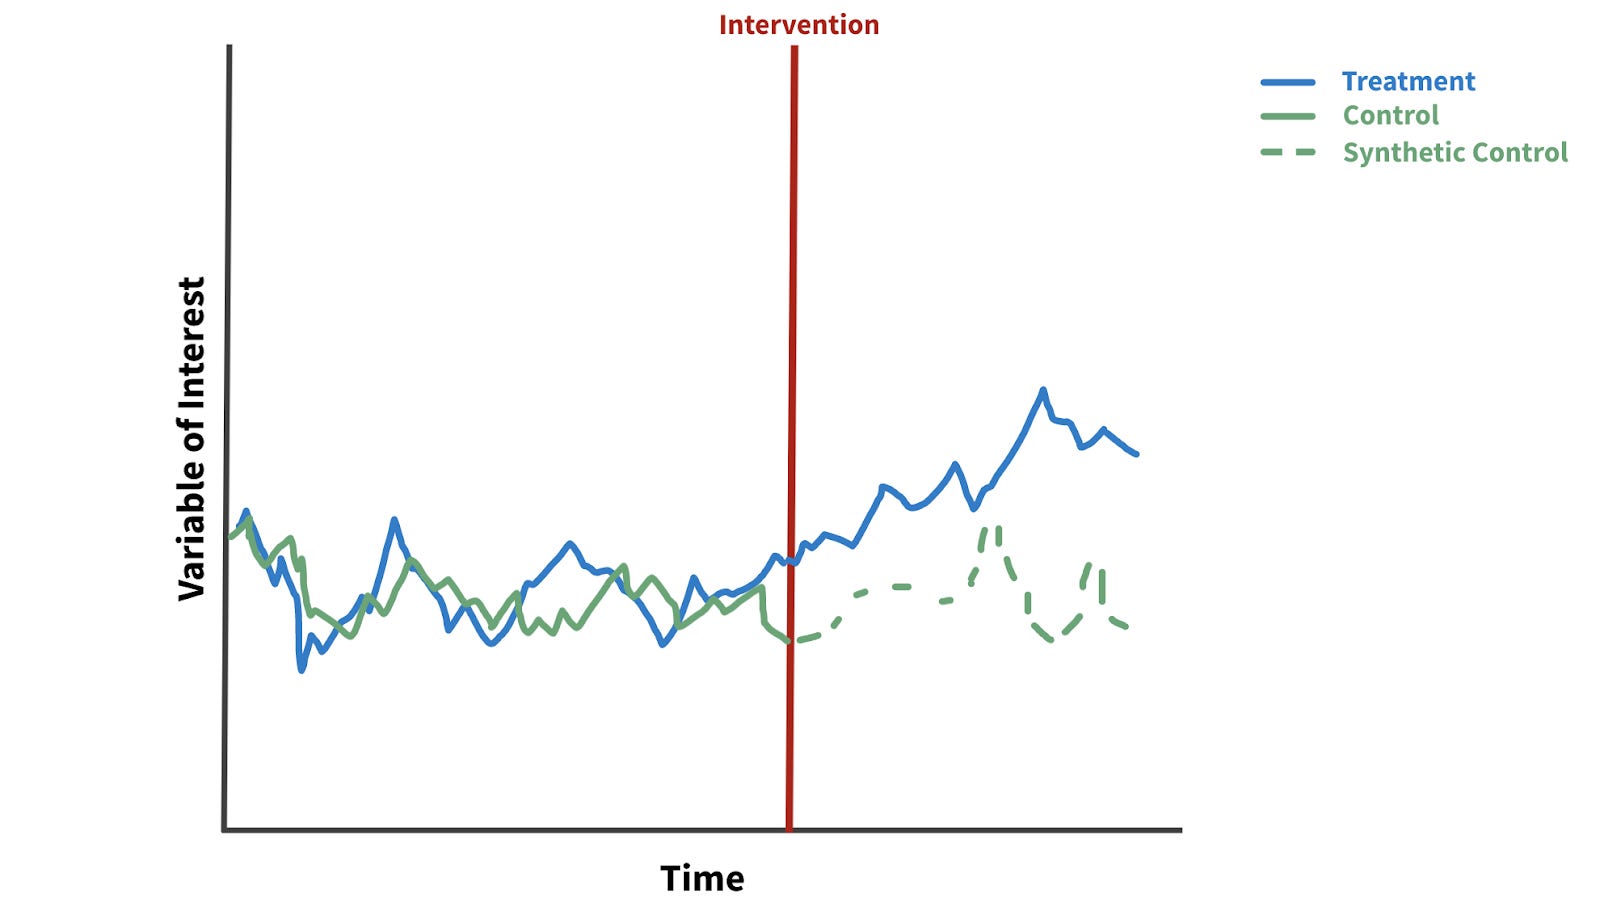
Time-based problems occur when an intervention happens over time, affecting multiple units simultaneously. Difference-in-Differences (DiD) and Synthetic Control methods compare changes in treated units relative to control units across time.
DiD Model:
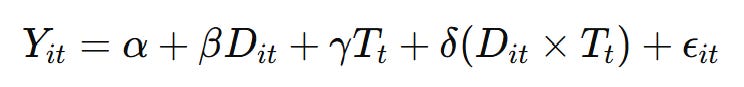
Here, delta estimates the causal effect by comparing pre/post changes in treated vs control units.
Industry Scenario:
A social media platform rolls out new content moderation rules in a subset of regions. By comparing engagement, posting frequency, and retention before and after the rollout against similar control regions, DiD analysis isolates the effect of moderation changes from general trends or seasonal variations.
A streaming service may introduce a seasonal promotional campaign, offering discounted subscriptions in select cities. Comparing changes in sign-ups, engagement, and retention between treated and control cities over time allows the platform to quantify the campaign’s causal impact.
Check out this detailed blog on Difference-in-Difference method and its industry applications.
Understanding the type of causal problem, the appropriate method, and how it applies across tech platforms equips Data Scientists to evaluate interventions rigorously, quantify impact, and make actionable recommendations.
Closing Thoughts: Making Causal Inference Work in Practice
Causal inference is more than a set of statistical tools — it’s a framework for structured decision-making. Whether you are testing a new feature, evaluating pricing strategies, or understanding the impact of a platform-wide policy, the goal is to isolate true cause-and-effect relationships and translate them into actionable insights.
Across tech platforms, the choice of method depends on the problem type: randomization, observational data, threshold assignments, or time-based interventions. Knowing which approach to apply ensures that your conclusions are credible, defensible, and aligned with business priorities.
As a senior or staff-level Data Scientist, your ability to combine rigorous methodology with business context is what drives high-impact decisions. Keep these principles in mind:
Understand the treatment assignment mechanism before choosing a method.
Always consider confounders and biases, especially in observational settings.
Focus on meaningful outcomes that link directly to business metrics like engagement, revenue, or retention.
Communicate assumptions and limitations clearly to stakeholders.
Leverage the right method for the problem type, whether randomized, threshold-based, observational, or time-dependent.
By integrating causal inference into your analytical toolkit, you can turn data into strategic insights, optimize platform interventions, and ultimately drive measurable business impact.
Remember: the most valuable insights don’t just come from running analyses — they come from asking the right causal questions and designing experiments and studies that answer them convincingly.
Upcoming Courses:
Master Product Sense and AB Testing, and learn to use statistical methods to drive product growth. I focus on inculcating a problem-solving mindset, and application of data-driven strategies, including A/B Testing, ML, and Causal Inference, to drive product growth.
A/B Testing Course for Data Scientists and Product Managers
Learn how top product data scientists frame hypotheses, pick the right metrics, and turn A/B test results into product decisions. This course combines product thinking, experimentation design, and storytelling—skills that set apart analysts who influence roadmaps.
Not sure which course aligns with your goals? Send me a message on LinkedIn with your background and aspirations, and I’ll help you find the best fit for your journey.