

Explain Like I am 5 | 21 Day Summary
Explain Like I’m Five Series | Primary, Secondary and Guardrail Metrics and their frameworks in A/B Testing? Sample Ratio Mismatch (SRM). Chi Square test and T-Test in A/B Testing

In the series “Explain like I’m 5” we are breaking down A/B testing topics that can be understood by even a 5-year-old.
👋 Hey! This is Manisha Arora from PrepVector. Welcome to the Tech Growth Series, a newsletter that aims to bridge the gap between academic knowledge and practical aspects of data science. My goal is to simplify complicated data concepts, share my perspectives on the latest trends, and share my learnings from building and leading data teams.
In last few posts we read about:
What is success/primary metric in A/B Testing?
What are Secondary and Guardrail Metrics in A/B Testing?
Framework for Primary, Secondary, and Guardrail Metrics
What is Sample Ratio Mismatch (SRM)?
What is the Chi-Square Test in A/B Testing?
What is the T-Test in A/B Testing?
Following is the quick revision of all the topics
What is success/primary metric in A/B Testing?
When you change something in your product, you can technically measure dozens of things. But measuring everything is not the same as measuring the right thing.
The primary metric is the single metric your experiment is explicitly designed to move, defined, documented, and locked in before you generate your first data point. Your test has one job: move this metric in the intended direction, with statistical significance. If it does, you have a winner. If it doesn’t, you don’t regardless of what happened to everything else.
What makes a good primary metric?
Measurable: Tracked precisely and consistently across both variants
Sensitive: Actually, responds to the type of change you are making
Meaningful: Connects directly to a real business outcome
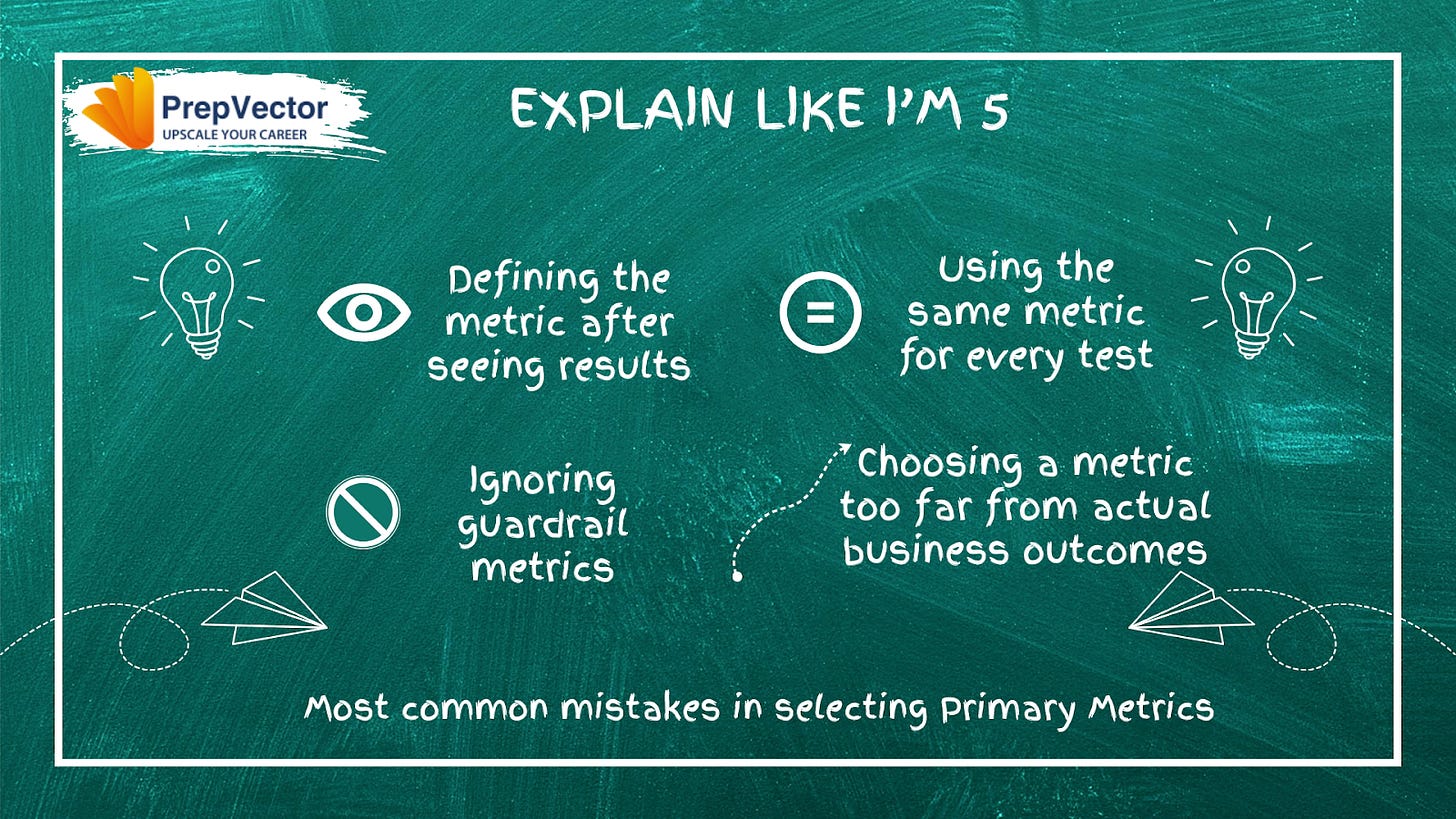
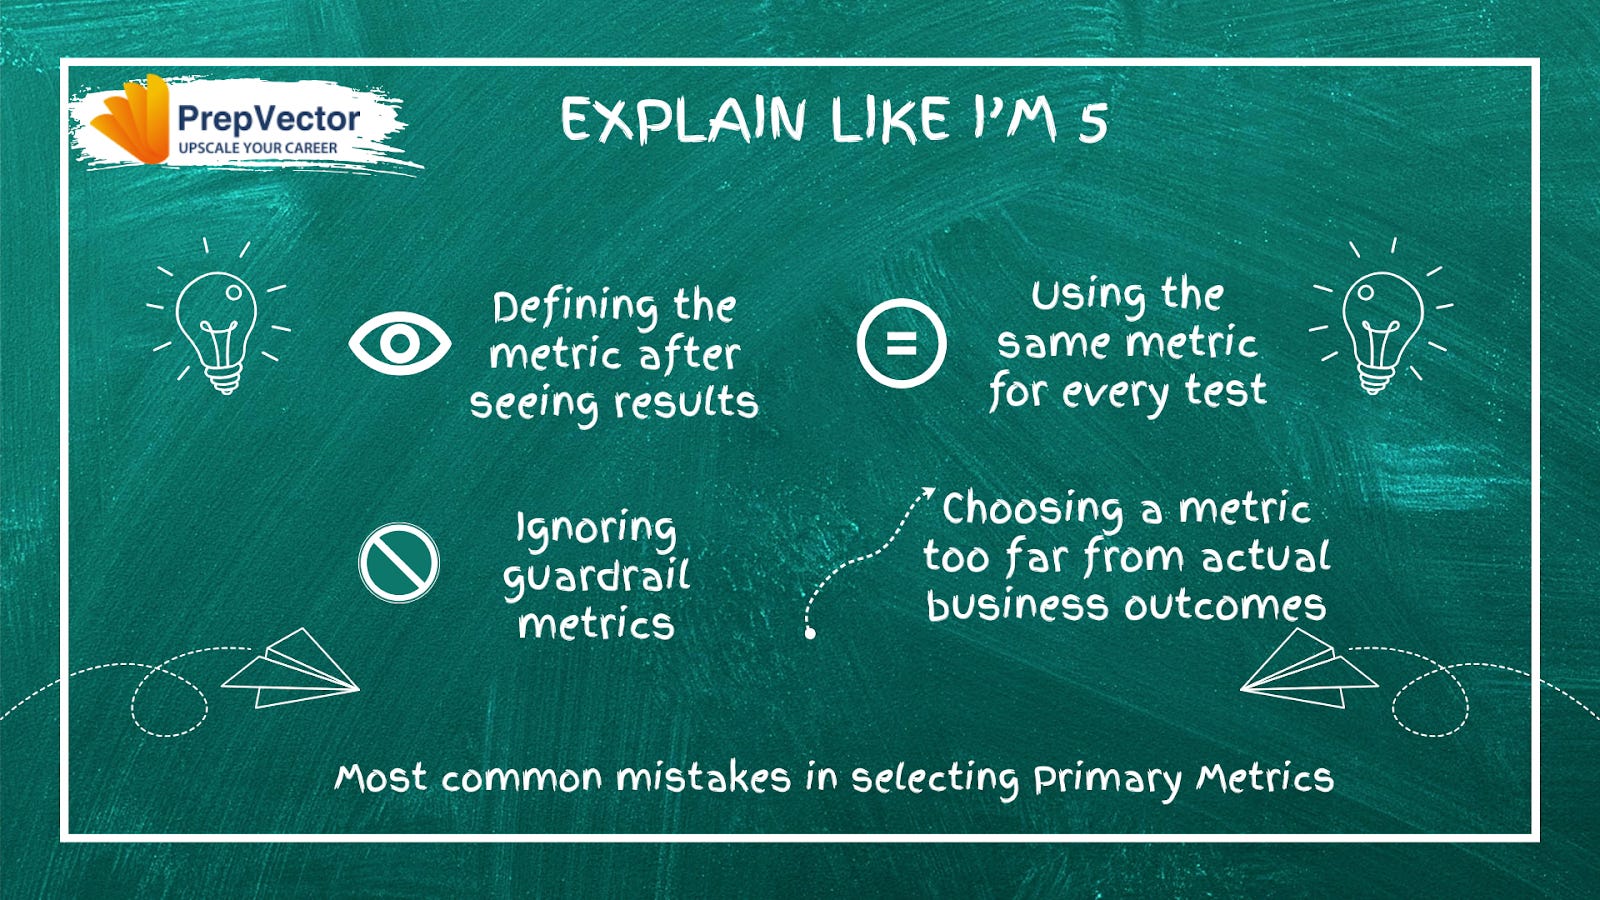
The most common mistakes:
Defining the metric after seeing results, this invalidates the test entirely
Choosing a metric too far from actual business outcomes like revenue or retention
Using the same metric for every test regardless of what is being tested
Ignoring guardrail metrics while optimizing the primary one
Few useful resources on primary metric in A/B Testing
Learn Primary/Secondary Metrics | A/B Testing Foundations
Choosing the right optimization KPI for your A/B tests
What are Secondary and Guardrail Metrics in A/B Testing?
Focusing exclusively on a single metric is dangerous. Your experiment might improve revenue but tank user satisfaction. This is where secondary and guardrail metrics come in.
The three-layer metric system:
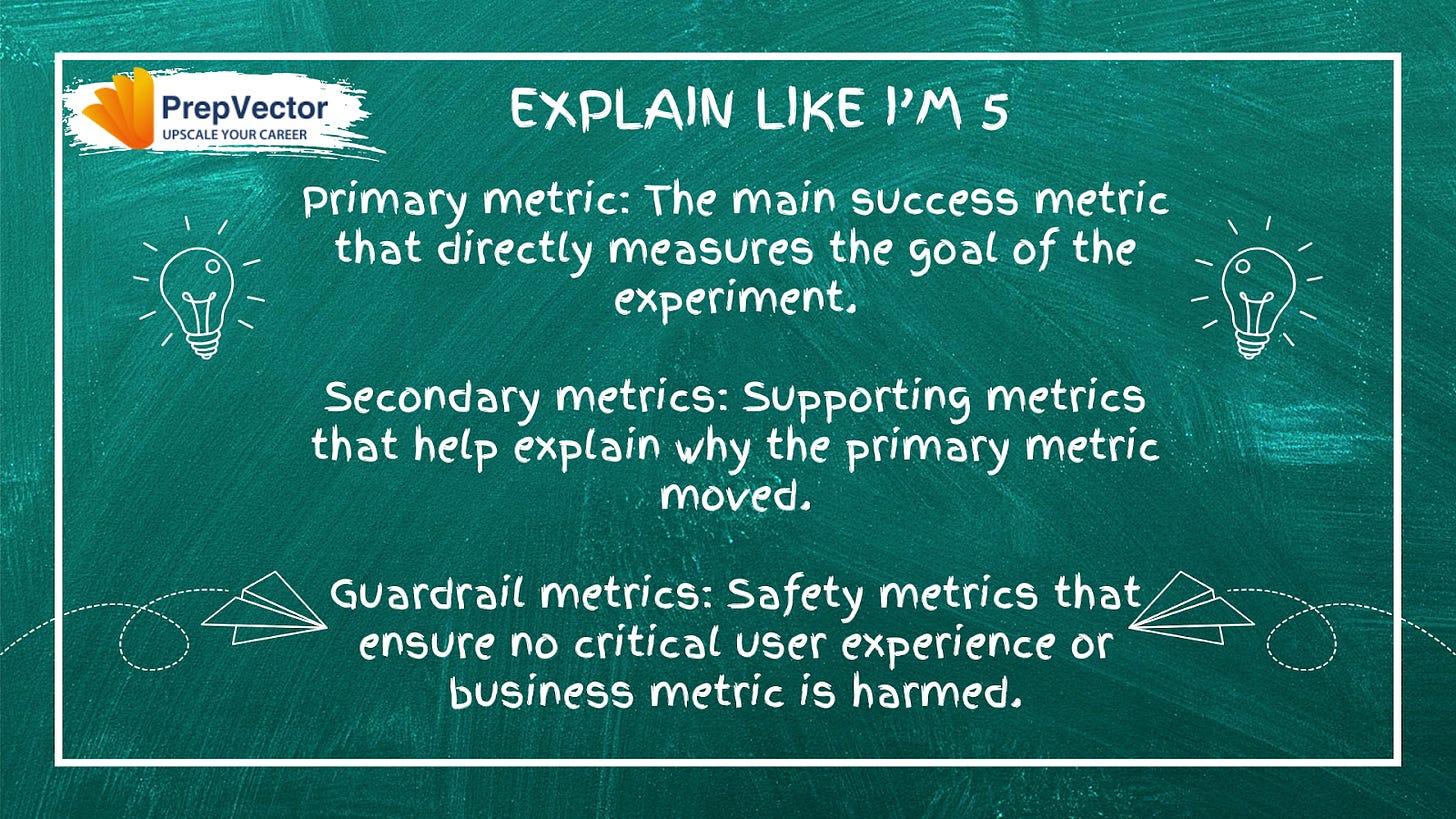
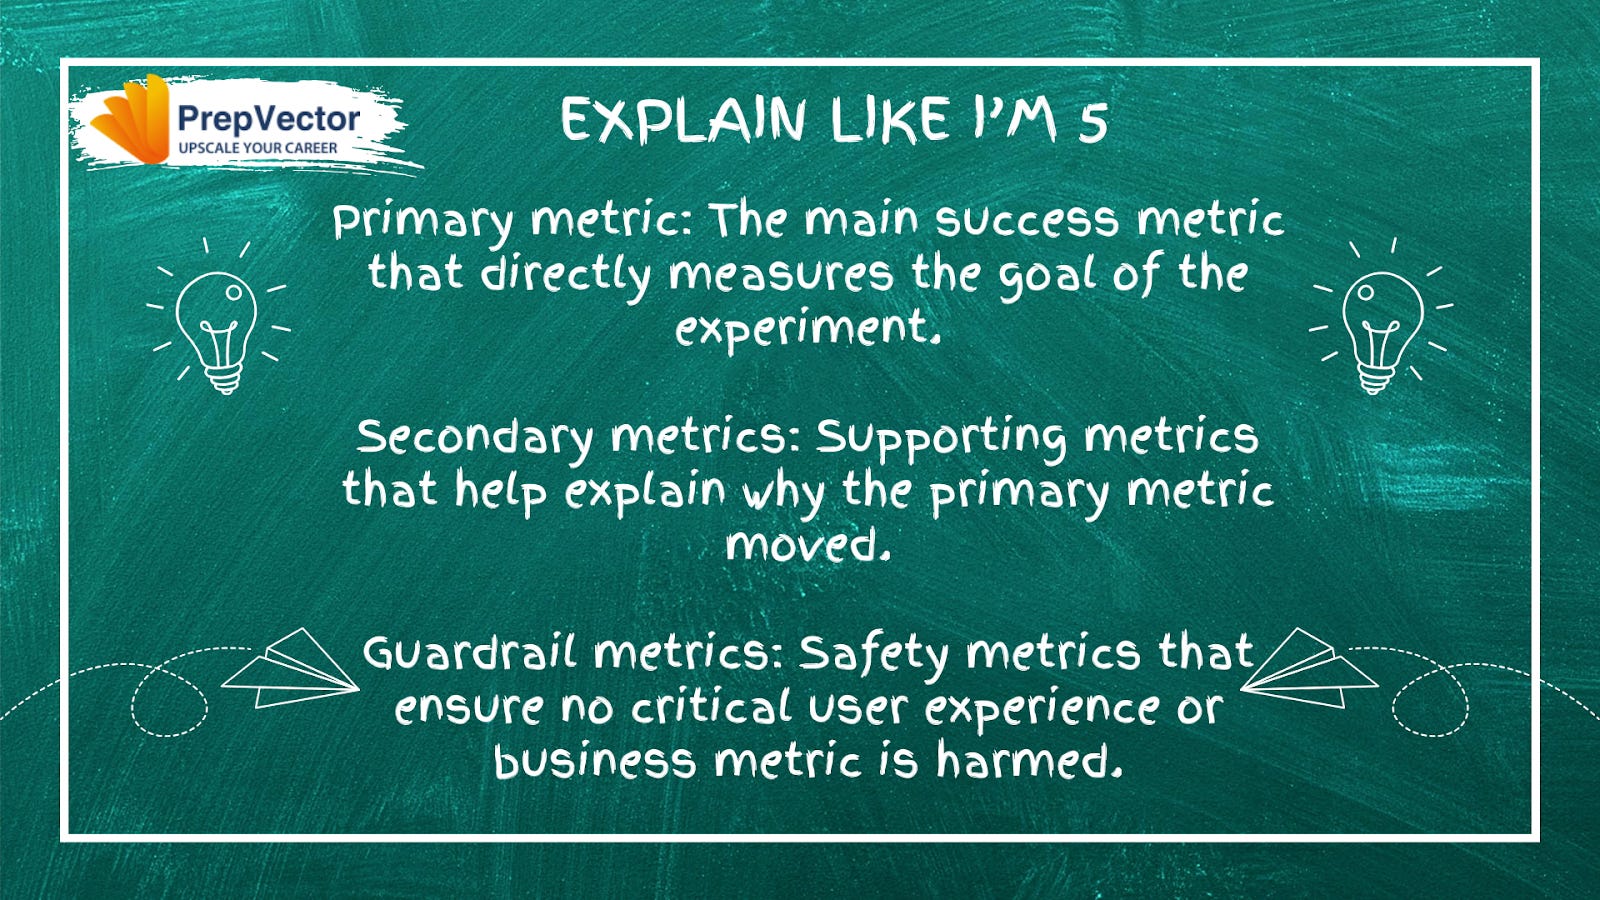
Primary metric: Determines win or loss. Non-negotiable after the test starts.
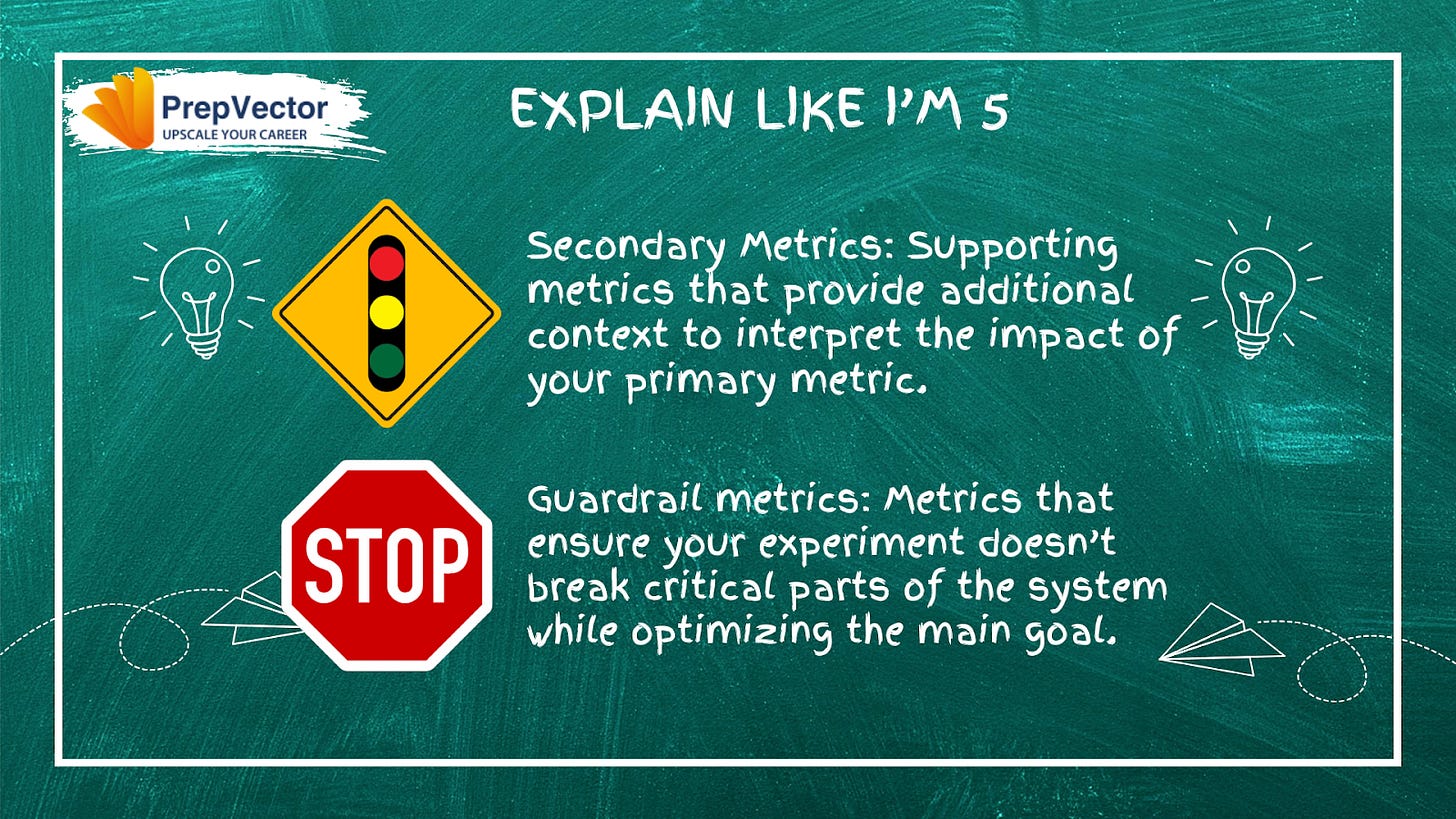
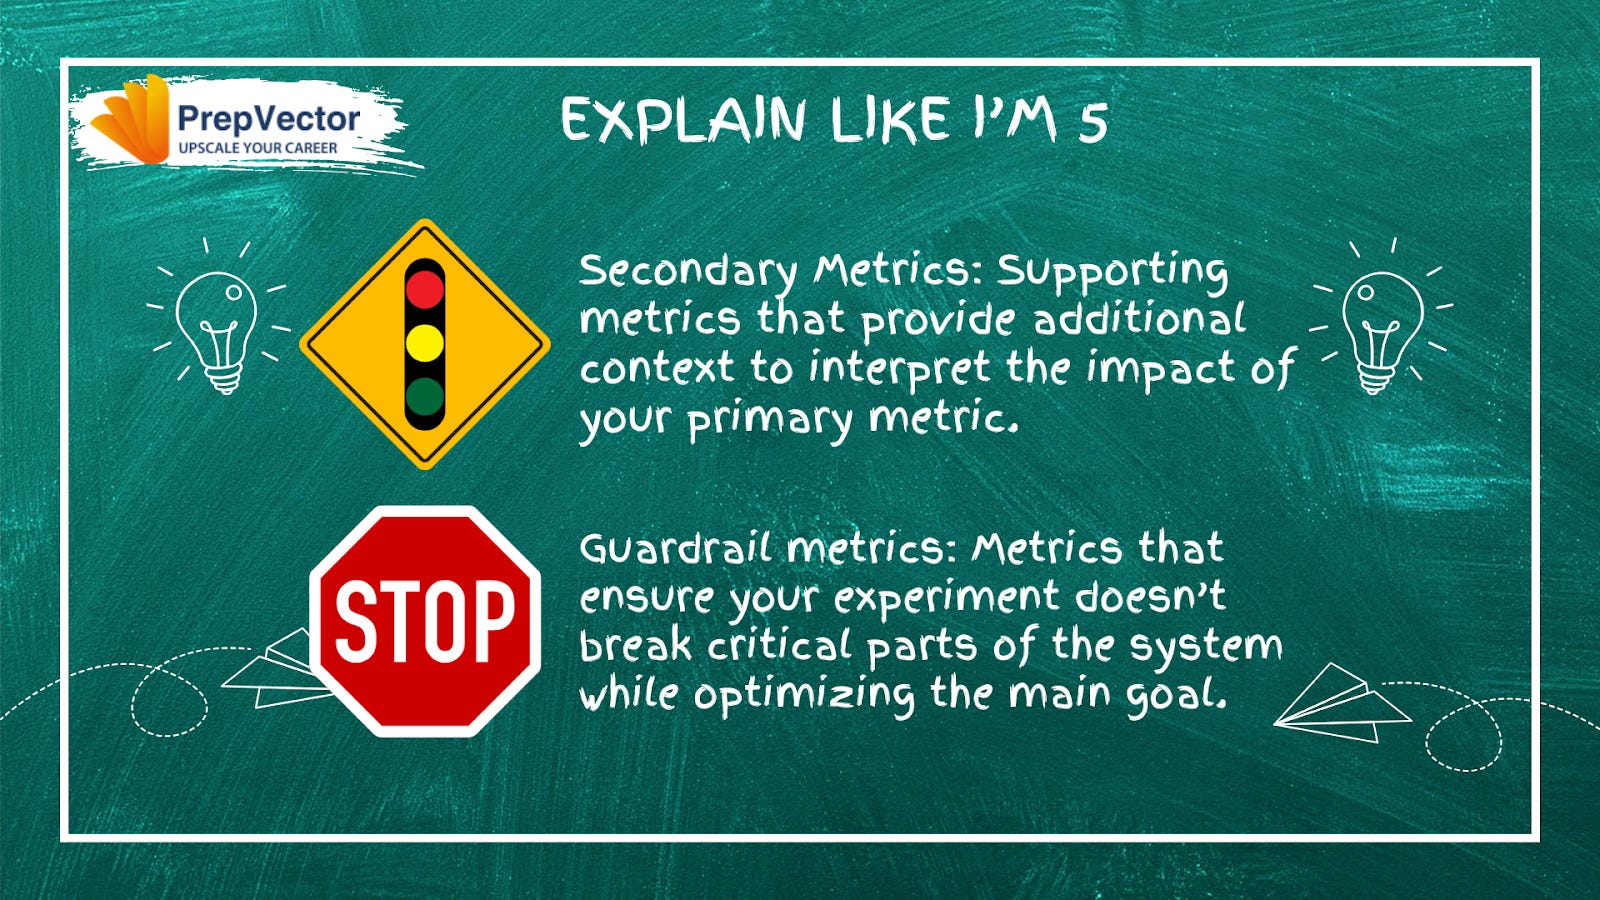
Secondary metrics: Provide context and explain the mechanism behind the primary result. They never override a primary metric verdict.
Guardrail metrics: The safety net with strict thresholds. If they worsen beyond those thresholds, you stop the test, regardless of what the primary metric shows.
Secondary metrics in practice: If your primary metric is revenue per session and it goes up alongside average order value, users are spending more per purchase. If average order value stays flat, the layout is simply driving more purchases. Same primary win, very different story.
Guardrail metrics in practice: An email CTR test shows an 18% lift — a clear primary win. But if the unsubscribe rate climbs from 1.2% to 2.8%, a guardrail threshold would have flagged this and prompted you to stop before the damage compounded.
The key distinction: a secondary metric moving unexpectedly is interesting. A guardrail metric crossing its threshold is a stop signal.
Few useful resources on Secondary and Guardrail metrics in A/B Testing
Secondary Metrics in A/B Testing and Why They Matter | LinkedIn
Guardrail Metrics in A/B Testing: How to Protect Experiments from Hidden Harm
Framework for Primary, Secondary, and Guardrail Metrics
Knowing what each metric type does is one thing. Consistently applying them before every experiment is another. Every metric type maps to a distinct question:
Did we achieve the goal? Primary metric
What did we learn along the way? Secondary metrics
Did we keep things safe? Guardrail metrics
Most teams struggle not because they don’t know what to track, but because they conflate these three questions, using learning metrics to override goal metrics, or ignoring safety metrics until something breaks.
The pre-experiment checklist:
Goal (Primary): What is the one metric this experiment is designed to move? What threshold constitutes a meaningful win?
Learning (Secondary): What three to five metrics will explain why the primary metric moved or didn’t? What behavioral signals sit between the intervention and the outcome?
Safety (Guardrail): What could this change plausibly break? What thresholds am I committing to not cross?
Most experiments fail not because they are badly run, but because success was never clearly defined upfront. This framework fixes that.
Few useful resources on Framework for Primary, Secondary and Guardrail metrics
Primary metrics, secondary metrics, and monitoring goals – Support Help Center
The No Jargon Guide to Understanding A/B Testing Metrics
What is Sample Ratio Mismatch (SRM)?
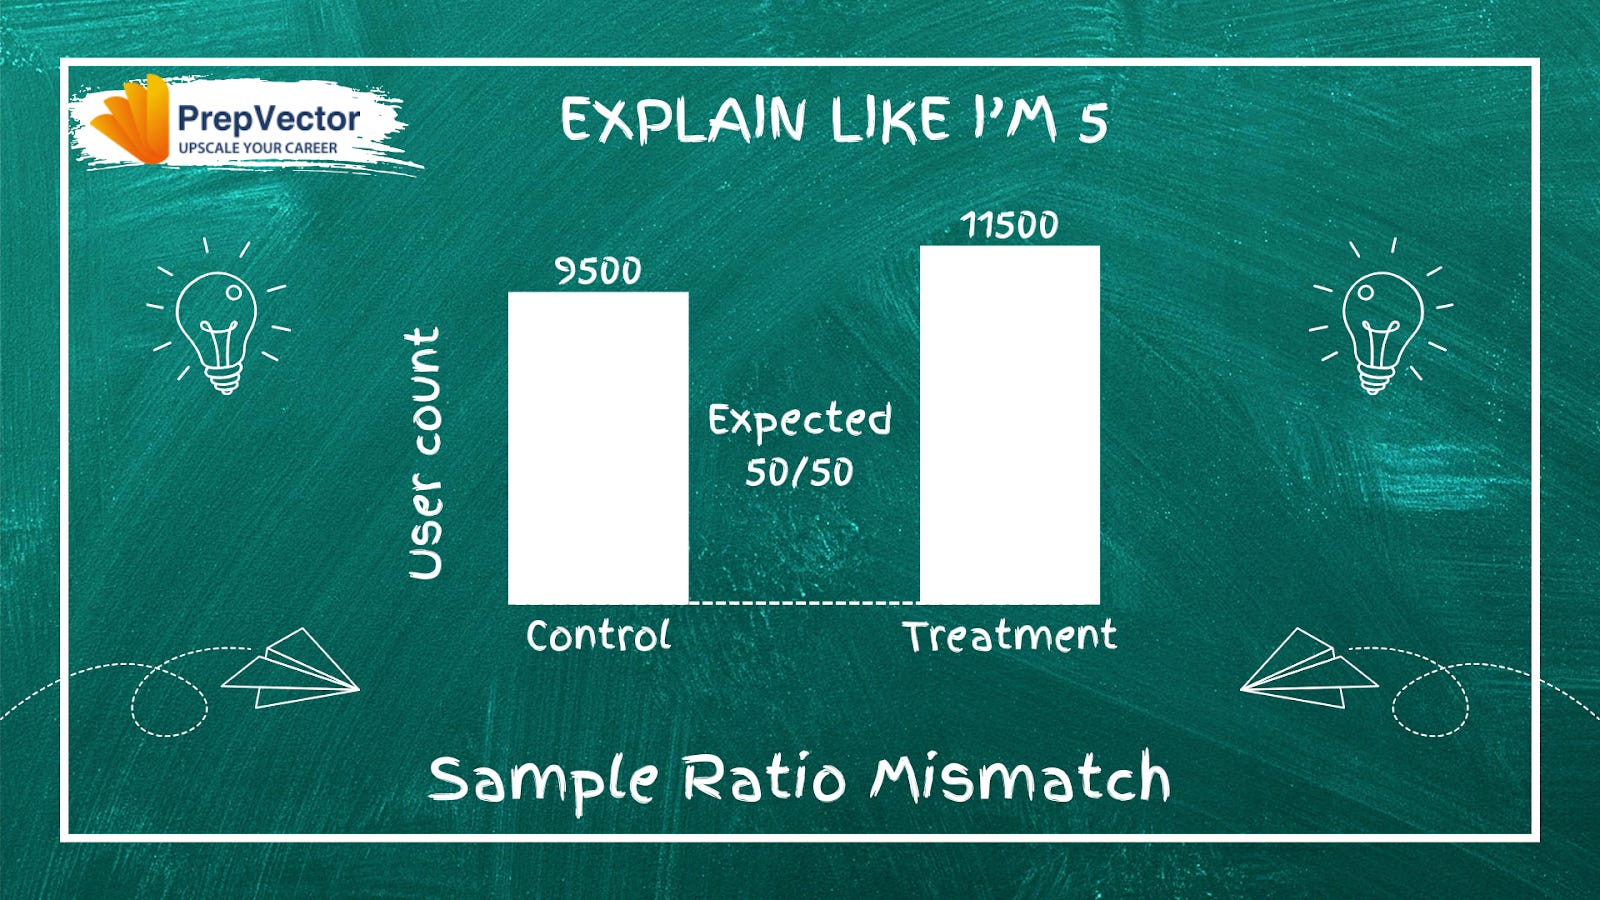
Before you trust any experiment results, there is one critical validity check most teams overlook: Sample Ratio Mismatch.
SRM occurs when the actual distribution of users between your test and control groups differs significantly from what you intended. In a 50/50 split, ending up with 60/40 or worse is a red flag that something went wrong in your setup.
Why SRM matters:
It violates the statistical assumption of random assignment
Failed randomization often correlates with device type, region, or behavior — introducing confounding variables
It inflates false positive rates, making you more likely to call a loser a winner
Common causes:
Buggy randomization logic in your assignment code
Assignment timing issues — users assigned at the wrong moment, or after already interacting with the variant
What to do: Do not proceed with analysis if you detect significant SRM. Investigate the root cause, fix it, and restart with clean data. Any results collected during an SRM period cannot be trusted.
Few useful resources on Sample Ratio Mismatch
Sample Ratio Mismatch: What Is It and How Does It Happen? - abtasty
Addressing the Challenges of Sample Ratio Mismatch in A/B Testing - DoorDash
What is the Chi-Square Test in A/B Testing?
The core idea: If variants A and B are truly equivalent, conversions should distribute proportionally across them. Chi-square quantifies exactly how far your observed results sit from that expectation.
Chi-square compares expected vs actual outcomes to determine if a gap is due to chance or a real problem. It produces a p-value to answer that question.
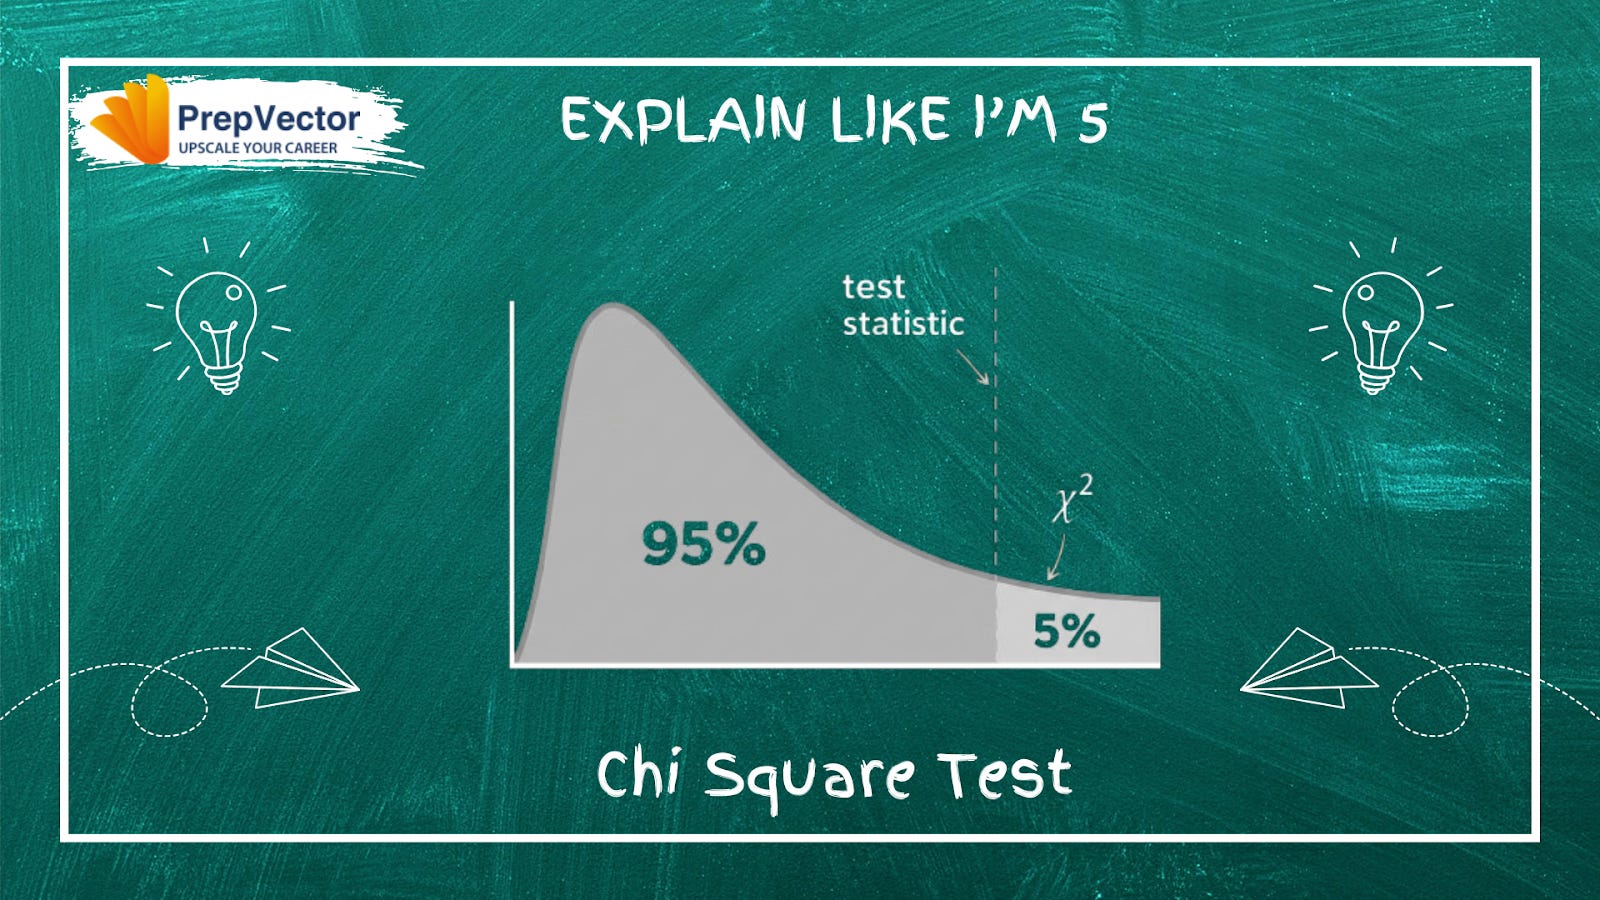
Reading the p-value:
p > 0.05: difference is normal, no issue
p < 0.05: difference is too large to be random; SRM is real
The 4-Step SRM Process:
Count first: Before analyzing metrics, verify user distribution matches your intended split (e.g., a 50/50 test shouldn’t show 65/35).
Run chi-square: Let the test objectively determine if the imbalance is luck or a broken system.
Diagnose the cause: Don’t touch your results yet. Investigate: wrong randomization ID, late assignment, bot traffic, or data pipeline issues.
Fix & restart: You can’t statistically patch SRM. Fix the root cause and rerun the experiment from scratch.
Always confirm your data split is fair before drawing any conclusions from an experiment.
Few useful resources on Chi-Square Test in A/B Testing
How to Use Chi Square to Fuel A/B Test? - Analytics Vidhya
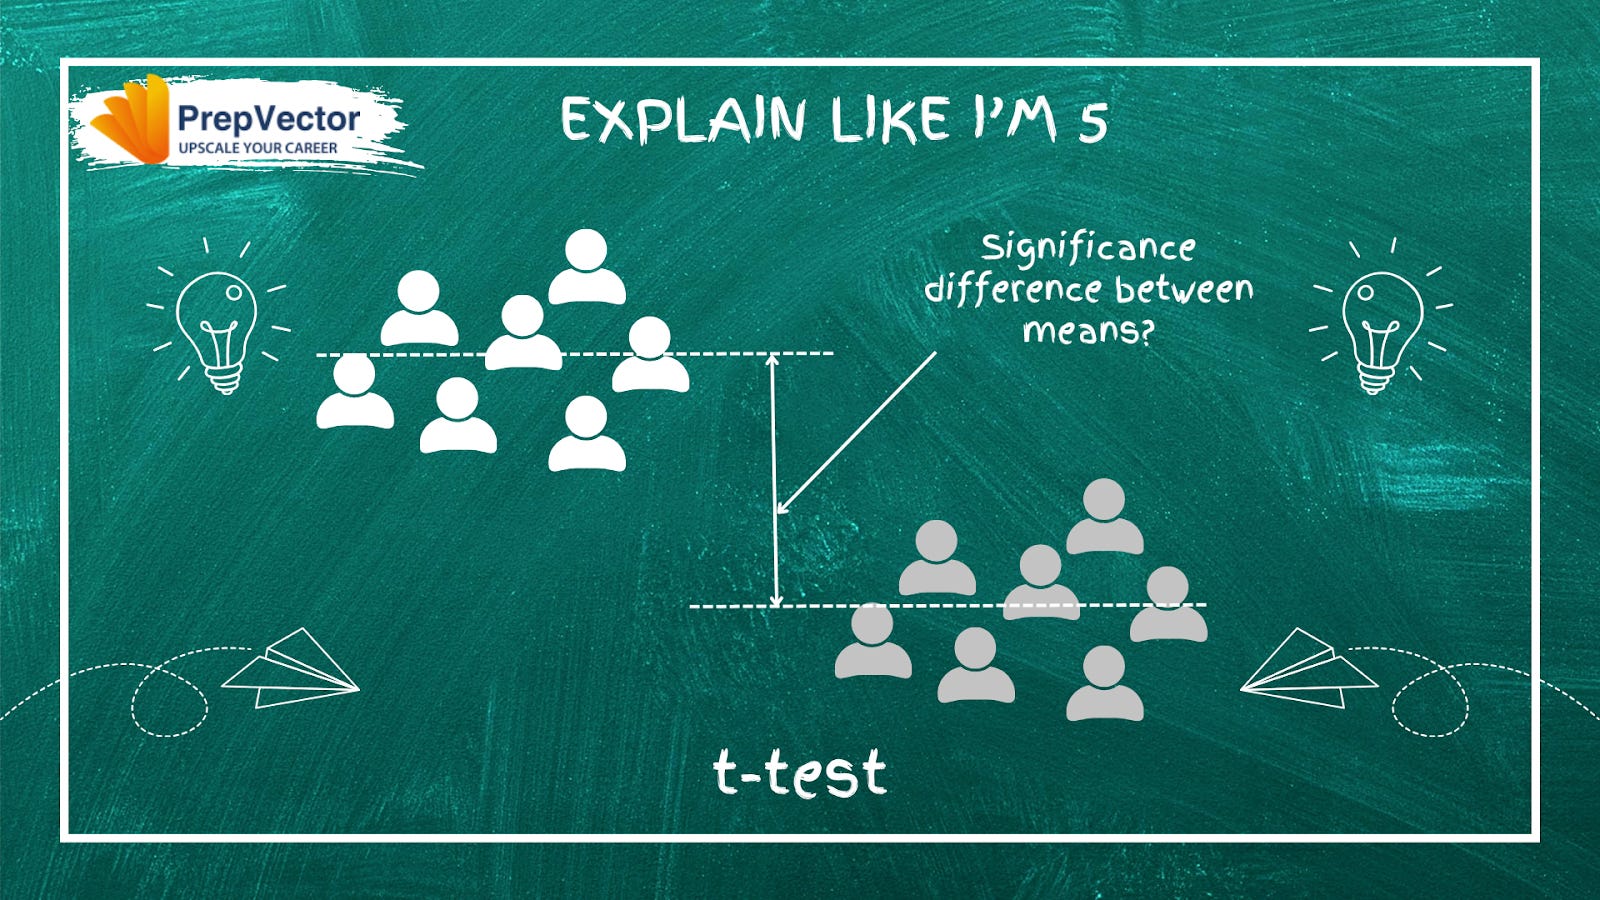
What is the T-Test in A/B Testing?
When your metric is continuous, revenue per session, average order value, time on page, the t-test is the right tool to determine whether the difference between variants is real or just noise.
How it works: The t-test weighs the difference between group means against the variance and sample size, producing a t-statistic: t = (mean_A − mean_B) / SE(difference). A large t-value signals a real effect. A small one suggests noise. The resulting p-value tells you the probability of seeing this result if there were truly no difference, if p < 0.05, the result is statistically significant.
Key types of t-tests:
Independent (two-sample): Two separate groups. Ex: old UI vs. new UI
Paired sample: Same users before and after a change
One-sample: One group compared against a fixed benchmark
Welch’s t-test: Like independent, but handles unequal variance between groups
When to use (and not use) t- test:
Use the t-test for continuous metrics like session duration or order value. Use chi-square for binary metrics like click or no click. Choosing the wrong test for your metric type is a subtle but meaningful error that undermines the validity of your results.
Few useful resources on T-test in A/B Testing
Bytepawn - Marton Trencseni – A/B testing and the t-test
A/B Testing using T-Test: Making Smart Decisions with Limited Data | by Thanh Tung Vu | Medium
If you’d like to dive deeper into experimentation, here are a few of our learning programs you might enjoy:
A/B Testing Course for Data Scientists and Product Managers
Learn how top product data scientists frame hypotheses, pick the right metrics, and turn A/B test results into product decisions. This course combines product thinking, experimentation design, and storytelling—skills that set apart analysts who influence roadmaps.
Advanced A/B Testing for Data Scientists
Master the experimentation frameworks used by leading tech teams. Learn to design powerful tests, analyze results with statistical rigor, and translate insights into product growth. A hands-on program for data scientists ready to influence strategy through experimentation.
Master Product Sense and AB Testing, and learn to use statistical methods to drive product growth. I focus on inculcating a problem-solving mindset, and application of data-driven strategies, including A/B Testing, ML, and Causal Inference, to drive product growth.
Not sure which course aligns with your goals? Send me a message on LinkedIn with your background and aspirations, and I’ll help you find the best fit for your journey.