

Interpreting A/B Test Results: Statistical vs. Practical Significance
Learn A/B testing basics, methodology, and how to interpret results with a focus on statistical vs. practical significance.

👋 Hey! This is Manisha Arora from PrepVector. Welcome to the Tech Growth Series, a newsletter that aims to bridge the gap between academic knowledge and practical aspects of data science. My goal is to simplify complicated data concepts, share my perspectives on the latest trends, and share my learnings from building and leading data teams.
In a world where data drives decisions, A/B testing has become an essential method for organizations to optimize their products, marketing strategies, and user experiences. Commonly referred to as split testing, A/B testing allows businesses to compare two versions of a product or feature to see which one performs better. Despite its simplicity, interpreting A/B test results can be challenging, especially when it comes to understanding the difference between statistical significance (Statsig) and practical significance (Pracsig). While Statsig helps determine if the results are unlikely to occur by chance, Pracsig ensures that the observed differences are meaningful and actionable for the business.
This comprehensive guide will cover the principles of A/B testing, its methodology, examples, challenges, and the nuances of interpreting results. Whether you're a technical expert or a non-technical stakeholder, this blog will help you harness the power of A/B testing effectively.
About the writers:
Manisha Arora: Manisha is a Data Science Lead at Google Ads, where she leads the Measurement & Incrementality vertical across Search, YouTube, and Shopping. She has 11+ years experience in enabling data-driven decision making for product growth.
Arnav Ashank: Arnav is a data scientist with expertise in analytics, experimentation, and machine learning. He specializes in turning data into actionable insights to drive business impact. From optimizing marketing strategies to analyzing user behavior, Arnav thrives on solving complex problems using data-driven approaches.
What is A/B Testing?
At its core, A/B testing is a controlled experiment that involves splitting a user population into two or more groups to test different variants of a product or feature. The control group (Group A) experiences the original version, while the experimental group (Group B) is exposed to the variation. The goal is to observe how the variation impacts a specific performance metric, such as click-through rates (CTR), conversion rates, or user engagement.
The history of A/B testing dates back to the 1920s when Ronald Fisher, a statistician, introduced randomized controlled trials in agriculture. These principles have since evolved and are now widely applied in digital marketing, e-commerce, app development, and other domains. Today, A/B testing allows businesses to make data-backed decisions, reducing reliance on intuition and guesswork.
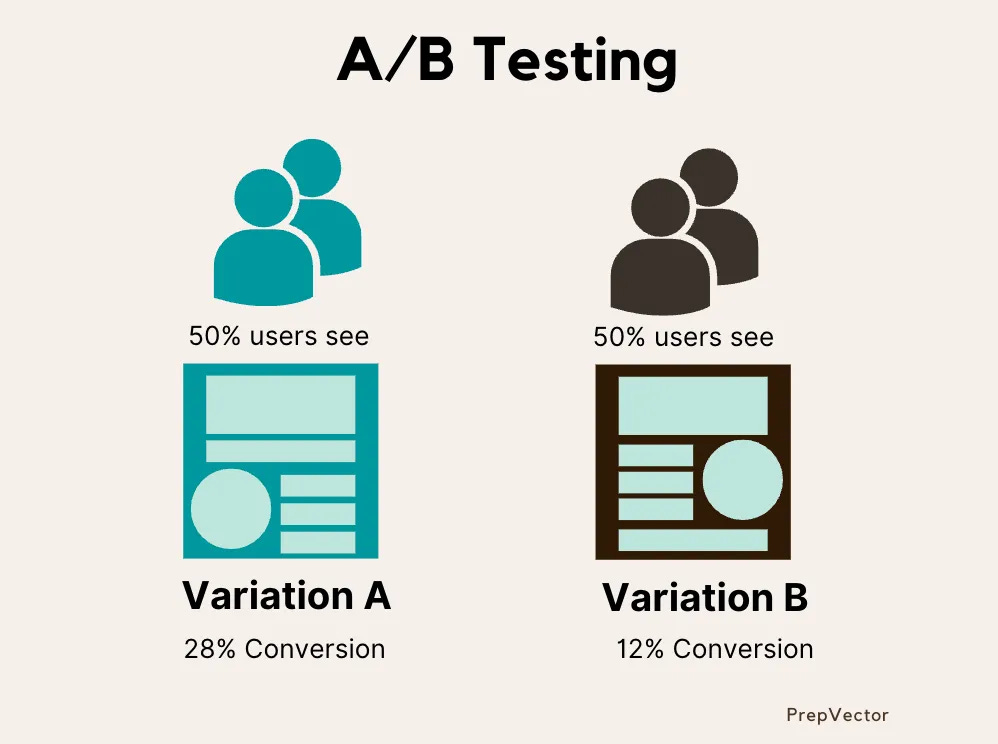
Example: Imagine an e-commerce platform testing two homepage designs. The control group sees the original design, while the experimental group views a new layout with larger images and a simplified navigation bar. The objective is to determine if the new design leads to higher purchase rates. By measuring key metrics, such as the percentage of users who complete a purchase, the company can decide which design to implement.
Methodology
Conducting an effective A/B test involves a systematic approach. Below are the key steps:
Define the Hypothesis- The hypothesis serves as the foundation of the A/B test. It should clearly state the expected outcome of the test. For example:
"Increasing the size of the 'Buy Now' button will improve the conversion rate by at least 5%."
A well-defined hypothesis ensures clarity and focus throughout the testing process.
Choose Primary and Secondary Metrics- Selecting the right metrics is crucial. The primary metric is the main measure of success for the experiment and should align directly with the business objective. Secondary metrics provide additional context and help identify unintended effects of the change.
Example:Primary Metric: Conversion rate (percentage of users completing a purchase).
Secondary Metrics: Average order value (AOV), bounce rate, or time on site.
Monitoring secondary metrics ensures that the experiment does not negatively impact other critical areas. For instance, a higher conversion rate might come at the cost of lower AOV, which may not be ideal for long-term business goals.
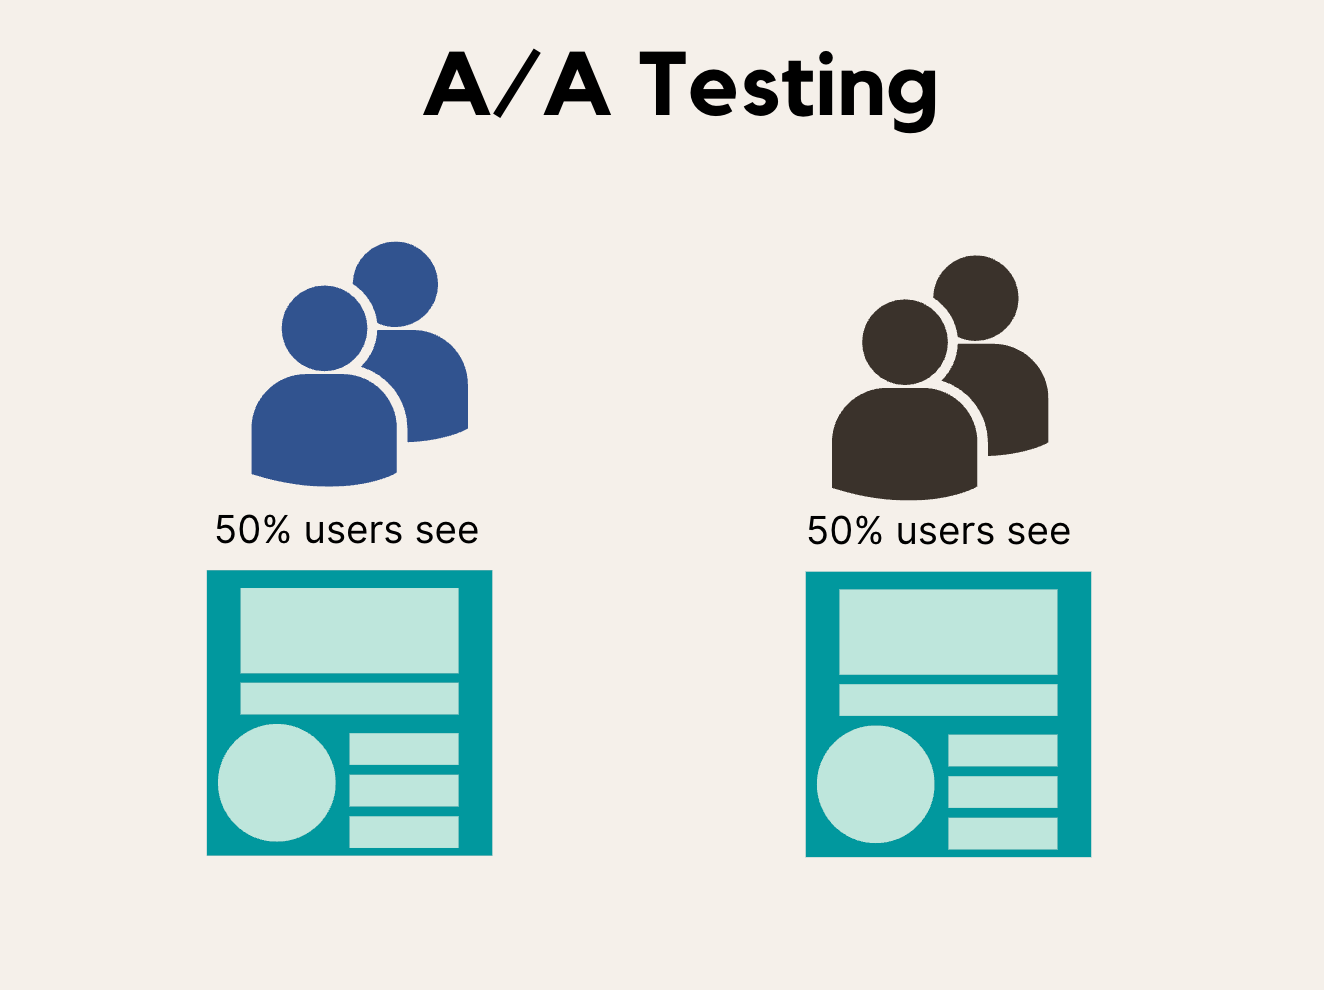
A/A Testing- Before A/B Testing Before launching an A/B test, conducting an A/A test ensures the reliability of your experimental setup. In an A/A test, the same version of the product is shown to two groups to validate:
Proper randomization of user allocation.
Consistency in data collection and metrics tracking.
Identification of baseline variance between groups.
Significance of A/A Testing:
Detects potential biases in data collection.
Validates the stability of your system.
Ensures no pre-existing anomalies that could skew A/B test results.
Example: If an A/A test reveals a significant difference in conversion rates between the two identical groups, this indicates an issue with randomization or data collection that must be addressed before proceeding.
Randomization and Segmentation- To ensure unbiased results, users must be randomly assigned to control and experimental groups. Additionally, segmentation can help analyze how different user demographics respond to the test.
Example: An A/B test for a mobile app might segment users by device type (iOS vs. Android) to ensure balanced representation in both groups.Power Analysis and Sample Size Calculation- Power analysis determines the sample size needed to detect a meaningful effect. This step ensures that the test results are statistically reliable. The key parameters include:
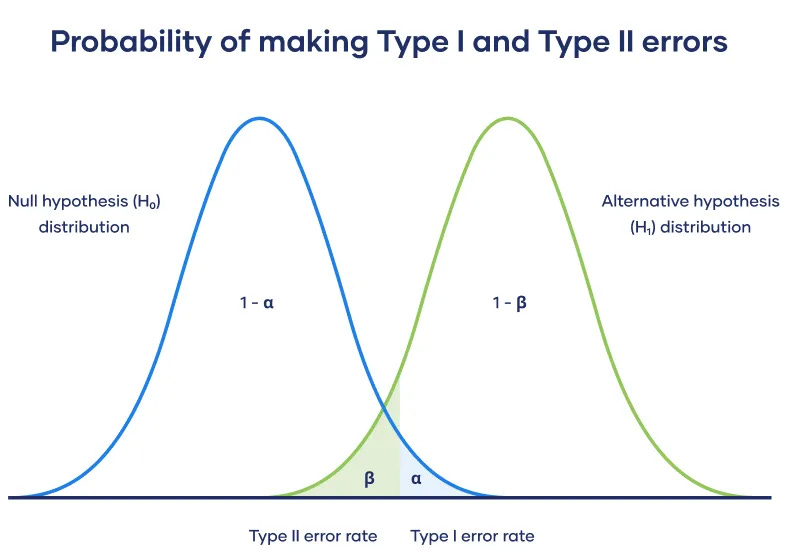
Significance level (α): Typically set at 5%.
Power (1-β): Commonly set at 80%.
Minimum detectable effect (MDE): The smallest effect size considered practically significant.
Example: A retailer wants to detect a 2% increase in conversion rates with 95% confidence. Using power analysis, they calculate the required sample size for each group.
Run the Test- Implement the test by exposing users to the control and experimental variants. Ensure that data collection mechanisms are accurate and consistent.
Analyze Results- Use statistical methods to evaluate the difference between the groups. Common tests include t-tests, z-tests, and chi-square tests.
Interpreting A/B Test Results
Statistical Significance (StatSig)
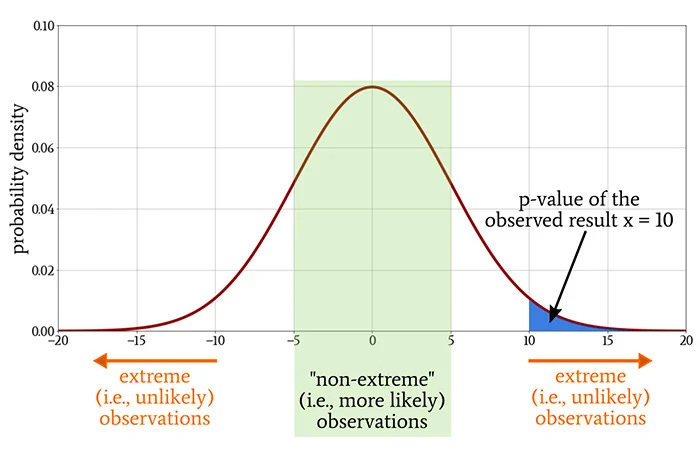
Statistical significance evaluates whether the observed differences between groups are unlikely to occur by chance. It is typically measured using a p-value.
p-value < 0.05: There is less than a 5% chance that the observed difference occurred by random variation. In this case, we reject the null hypothesis and conclude that the result is statistically significant.
p-value ≥ 0.05: The observed difference could reasonably occur by chance, and we fail to reject the null hypothesis.
For more details on the risks associated with AB testing, refer to the blog here about experimental implications.
Example: In an email marketing campaign, the control group has a click-through rate of 15%, and the experimental group achieves 18%. A t-test reveals a p-value of 0.03, indicating that the improvement is statistically significant.
However, statistical significance doesn’t tell us whether this result is meaningful in a real-world context. This is where practical significance comes into play.
Practical Significance (PracSig)
Practical significance assesses whether the observed effect is meaningful in a real-world context. While Statsig confirms reliability, Pracsig determines relevance.
Practical significance evaluates whether the observed effect is large enough to matter in a business context. It’s not just about whether a difference exists but whether that difference justifies action.
Example: Continuing the email campaign example, a 3% improvement might translate to significant revenue for a large enterprise but could be negligible for a small business. Pracsig depends on factors like ROI, implementation costs, and scalability.
Statistical significance is a mathematical threshold, while practical significance incorporates business impact.
Examples and Use Cases
E-Commerce Homepage Redesign
Scenario: An e-commerce company tests a new homepage design with simplified navigation.
Metrics: Conversion rate and average order value (AOV).
Result: The new design increases conversions by 1.5% (p < 0.05). However, the implementation cost is high, and the ROI analysis shows a break-even point at 18 months. The company decides to prioritize other projects.
App Feature Testing
Scenario: A streaming platform introduces a "Continue Watching" feature.
Metrics: User engagement (average watch time).
Result: Engagement improves by 10%, with a p-value of 0.001. Practical analysis shows the feature enhances user retention, leading to higher subscription renewals.
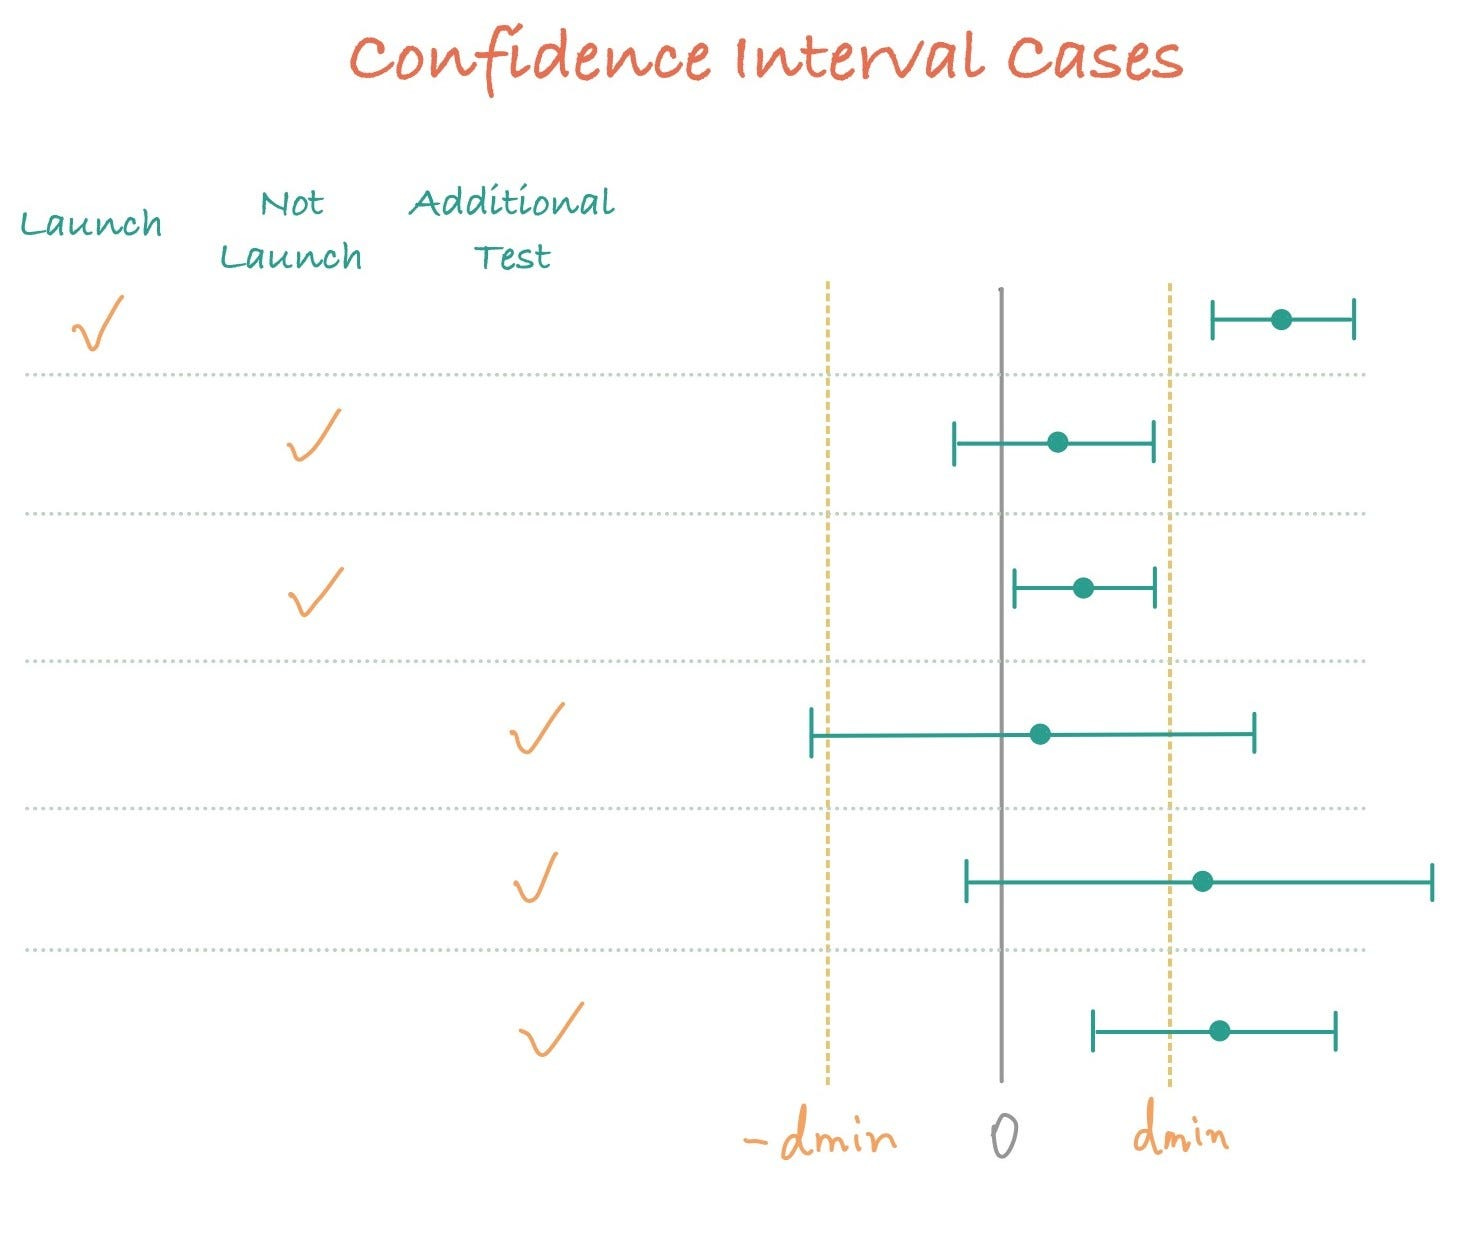
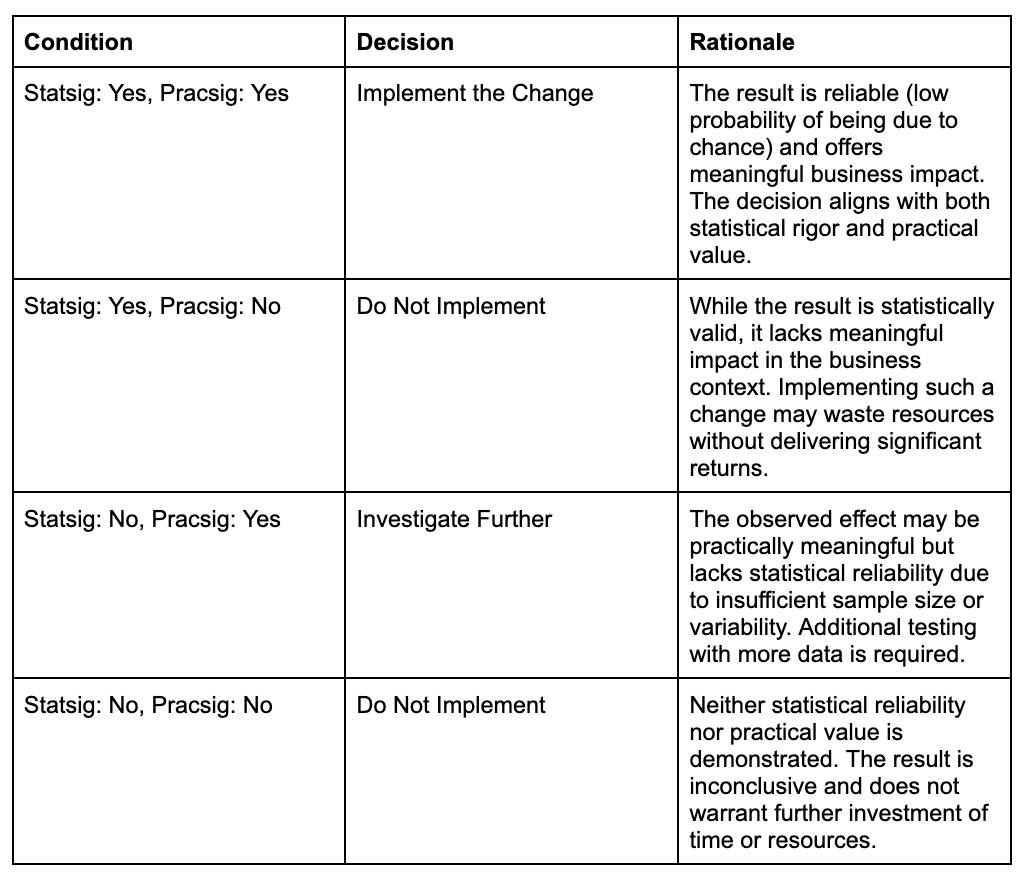
Decision-Making: Statistical vs. Practical Significance
In the real world, results often fall into gray areas, requiring careful interpretation to determine the next steps. To navigate these scenarios, the following decision matrix combines statistical and practical significance to guide decisions:
Conclusion
A/B testing is a powerful tool for data-driven decision-making, bridging the gap between intuition and evidence. By understanding both Statsig and Pracsig, businesses can derive actionable insights and drive meaningful outcomes. Remember, an A/B test is not just about finding what works—it’s about learning and evolving. Through careful planning, execution, and analysis, organizations can unlock the full potential of A/B testing and make impactful decisions.
References
https://pmc.ncbi.nlm.nih.gov/articles/PMC3371560/pdf/JAIM-3-65.pdf
https://www.sciencedirect.com/science/article/pii/S0164121224000542
https://news.lunartech.ai/simple-and-complet-guide-to-a-b-testing-c34154d0ce5a
This blog was co-authored by Manisha Arora & Arnav Ashank. A huge thank you to Arnav for sharing his knowledge and in AB Testing.
Check out my upcoming courses:
Master Product Sense and AB Testing, and learn to use statistical methods to drive product growth. I focus on inculcating a problem-solving mindset, and application of data-driven strategies, including A/B Testing, ML and Causal Inference, to drive product growth.
AI/ML Projects for Data Professionals
Gain hands-on experience and build a portfolio of industry AI/ML projects. Scope ML Projects, get stakeholder buy-in, and execute the workflow from data exploration to model deployment. You will learn to use coding best practices to solve end-to-end AI/ML Projects to showcase to the employer or clients.
Machine Learning Engineering Bootcamp
Learn the intricacies of designing and implementing robust machine learning systems. This course covers essential topics such as ML architecture, data pipeline engineering, model serving, and monitoring. Gain practical skills in deploying scalable ML solutions and optimizing performance, ensuring your models are production-ready and resilient in real-world environments.
Not sure which course aligns with your goals? Send me a message on LinkedIn with your background and aspirations, and I'll help you find the best fit for your journey.
Thanks so much for providing comprehensive explanation related to AB testing. Could you please recommend any materials or videos available to further solidify the knowledge in AB testing which might be useful for cracking the product data science position. ?