

Quantifying the Impact of Free Shipping: A PSM Case Study (Part 1/2)
Evaluate how free shipping affects membership conversions using Propensity Score Matching — a step-by-step case study showing how causal inference can guide product decisions without A/B testing.


👋 Hey! This is Manisha Arora from PrepVector. Welcome to the Tech Growth Series, a newsletter that aims to bridge the gap between academic knowledge and practical aspects of data science. My goal is to simplify complicated data concepts, share my perspectives on the latest trends, and share my learnings from building and leading data teams
In the last edition, we introduced the foundational problem of causal inference: estimating the effect of a treatment when we only observe one outcome per individual. We discussed why naive comparisons between treated and untreated groups often lead to biased estimates, and how Propensity Score Matching (PSM) offers a principled way to simulate randomized experiments from observational data.
We also covered the key assumptions behind PSM—particularly conditional independence and overlap—and outlined the standard methodology: estimate propensity scores, match units with similar scores, check for balance, and estimate the treatment effect.
In this edition, we put theory into practice. We’ll walk through a real-world business case, applying PSM step by step to estimate the causal effect of a new benefit on customer conversion rates.
About the Authors:
Manisha Arora: Manisha is a Data Science Lead at Google Ads, where she leads the Measurement & Incrementality vertical across Search, YouTube, and Shopping. She has 12+ years of experience in enabling data-driven decision-making for product growth.
Banani Mohapatra: Banani is a seasoned data science product leader with over 12 years of experience across e-commerce, payments, and real estate domains. She currently leads a data science team for Walmart’s subscription product, driving growth while supporting fraud prevention and payment optimization. She is known for translating complex data into strategic solutions that accelerate business outcomes.
Business Case: Measuring the Impact of Free Shipping on Subscription Conversions
Imagine you're working at a delivery service company that offers a premium membership program. To drive more upgrades from free trial users, the company is considering adding free shipping as a core benefit to the paid plan.
The hypothesis: Free shipping will increase the conversion rate from trial to paid membership.
The product and analytics teams want to quantify this impact. The ideal setup is a Randomized Controlled Trial (RCT), where some users get the free shipping benefit and others don’t. But there's a problem.
Since all paying members are charged the same fee, giving free shipping to a subset of users during the trial period risks fairness concerns, customer confusion, and brand dilution. So the team decides to roll out the benefit to ALL users at once.
This creates a classic challenge: No randomized control group.
So how do we estimate the true causal effect of free shipping on conversion—while accounting for potential confounders like user engagement, geography, or historical purchase behavior?
This is where Propensity Score Matching becomes invaluable. By modeling the probability of receiving the benefit (based on observable features) and matching users accordingly, we can construct a synthetic control group and approximate the conditions of a randomized experiment.
In the sections ahead, we’ll:
Define the dataset and treatment framework,
Implement PSM step by step in code,
Estimate the treatment effect,
And discuss how to evaluate the quality of our causal estimate.
Methodology: Step-by-Step Breakdown of Propensity Score Matching Algorithm
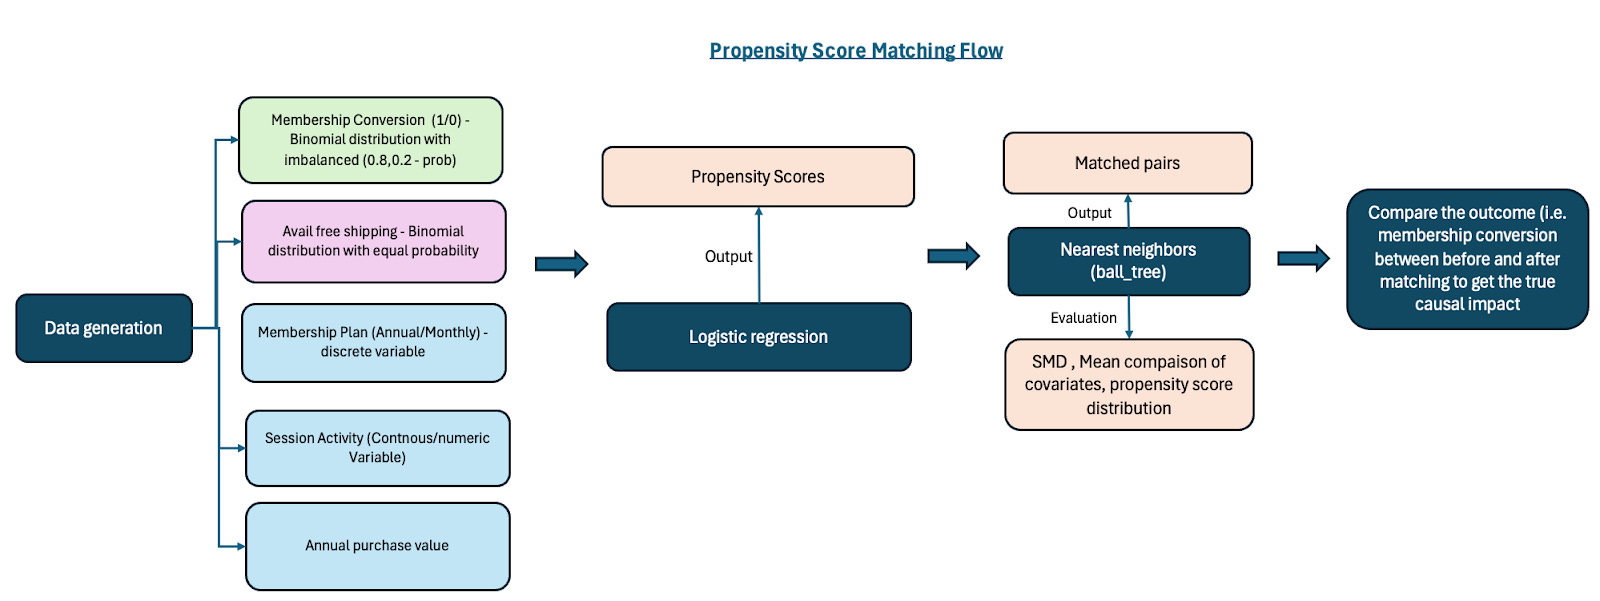
This methodology outlines the Propensity Score Matching (PSM) approach used to estimate the causal impact of free shipping on membership conversion. The process involves data generation, propensity score estimation, matching, and outcome evaluation, as illustrated in the below diagram.
Figure1: Outlines the implementation process of PSM
Data Setup & Defining the Framework
Before we dive into implementation, let’s formalize the problem using the language of causal inference.
Treatment & Outcome
Treatment (T): Whether a user received the free shipping benefit during their freemium trial.
T = 1: Received free shipping
T = 0: Did not receive free shipping
Outcome (Y): Whether the user converted to a paid membership at the end of the trial.
Y = 1: Converted
Y = 0: Did not convert
Our goal is to estimate the Average Treatment Effect on the Treated (ATT):
ATT = E [ Y(1) - Y(0) | T=1]
We observe Y(1) for treated users, but not their counterfactual Y(0). PSM helps us estimate that counterfactual by constructing a matched control group of untreated users who look similar to the treated users in terms of observed characteristics.
Covariates
To estimate propensity scores and perform matching, we need covariates that:
Are predictive of both treatment assignment and the outcome
Are not affected by the treatment (i.e., measured before the intervention)
Examples of covariates can include:
User tenure (days since sign-up)
App usage during trial (e.g., number of sessions, delivery searches)
Historical conversion behavior (past conversion rates for similar users)
Location/geography
Device type or platform
Marketing channel (how the user came to the platform)
For simplicity, we will limit ourselves to the following covariates:
Membership Conversion (1/0) – This is our outcome of interest. Did the user convert to a paid membership? It’s a simple yes (1) or no (0).
Free Shipping Availability – This is our treatment variable. Did the user receive the free shipping benefit? Again, it’s binary: yes (1) or no (0).
Membership Plan (Annual/Monthly) – One of our key covariates (X1), capturing the type of subscription the user chose.
Session Activity – Another covariate (X2), this one is continuous and reflects how engaged the user is on the platform. Think: number of sessions, time spent, etc.
Annual Purchase Value – Our third covariate (X3), showing how much the user spends in a year. This helps us understand purchasing behavior across the groups.
Note: To make the simulation realistic, treatment assignment (free shipping) depends slightly on user features like purchase value, session activity, and membership plan. Baseline membership conversion also varies based on these covariates, with a 5% uplift for users who receive free shipping. This creates a confounded but controlled environment where Propensity Score Matching (PSM) is needed to uncover the true treatment effect.
We now have a treatment indicator, an outcome, and a set of pre-treatment covariates.
Understanding the Causal Story Behind the Data
Now that we’ve simulated the data, let’s step back and ask: What exactly are we trying to estimate?
We want to know whether giving users free shipping leads to a higher chance of them converting to a paid membership. Simple enough, right? But the reality is a bit more nuanced.
Before jumping into the analysis, we partnered with business and product stakeholders to brainstorm what factors might be influencing both treatment and outcome. The goal was to surface realistic behavioral and product-related variables that could confound this relationship.
Think about it:
A user with high session activity might be more engaged—and therefore both more likely to receive free shipping and more likely to convert.
A user with a higher annual purchase value might already be seen as valuable by the system and naturally more inclined to convert.
The type of membership plan (monthly vs. annual) could also correlate with user intent or brand loyalty—factors that affect conversion.
The outcome of these brainstorming sessions was the causal diagram below, which incorporates real user flows, business logic, and engagement patterns to highlight the key confounding relationships impacting conversion.
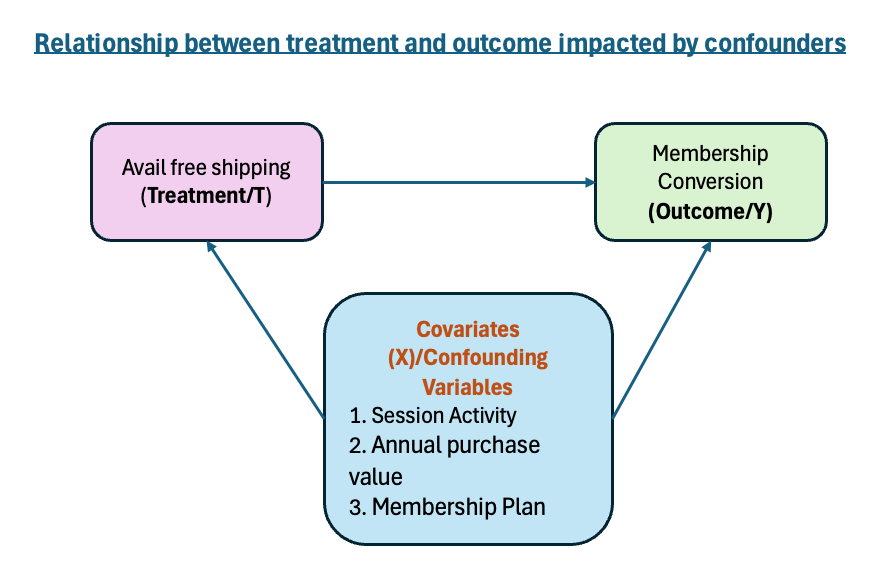
Figure2: causal diagram highlighting the impact of covariates (confounders) on both treatment (T) and outcome (Y), violating the independence assumption for treatment estimation.
These covariates (or confounding variables) make it tricky to tease out the true effect of free shipping. If we ignore them, we risk attributing conversion to free shipping when it may actually be due to these other factors.
That’s why we need a technique like Propensity Score Matching—to create a level playing field by balancing these covariates across the treated and untreated groups. Only then can we isolate the actual impact of the treatment.
Step 1: Scoring the Odds: Estimating Propensities
Here’s where we get things rolling. We use logistic regression to estimate each user’s likelihood of receiving free shipping—aka their propensity score. This score is based on observed factors like purchase value, session activity, and plan type, helping us create apples-to-apples comparisons between users who got the benefit and those who didn’t.
📐 What does this score really mean?
It’s the probability of a user being in the treatment group (i.e., getting free shipping), given what we know about them. Only included variables that affect both treatment and outcome to reduce bias.
Mathematically, it looks like this:
P(Treatment = 1|X) = Propensity Score
P(T=1∣X)=logistic(β0+β1X1+β2X2+β3X3)
Where X includes all the observed variables about the user. Think of it as a fair way to compare users who got free shipping with those who didn’t—but who looked similar based on the data. Now, each user has a score between 0 and 1 indicating how likely they were to receive the treatment based on observables.
To be continued in the next edition ….
What’s Next?
In this edition, we defined the business problem, selected key covariates, and set the stage for matching.
Up next: we’ll walk through how to evaluate the propensity scores, perform the matching, and interpret the impact of free shipping on conversions—step by step.
Upcoming Courses:
Master Product Sense and AB Testing, and learn to use statistical methods to drive product growth. I focus on inculcating a problem-solving mindset, and application of data-driven strategies, including A/B Testing, ML, and Causal Inference, to drive product growth.
AI/ML Projects for Data Professionals
Gain hands-on experience and build a portfolio of industry AI/ML projects. Scope ML Projects, get stakeholder buy-in, and execute the workflow from data exploration to model deployment. You will learn to use coding best practices to solve end-to-end AI/ML Projects to showcase to the employer or clients.
Not sure which course aligns with your goals? Send me a message on LinkedIn with your background and aspirations, and I'll help you find the best fit for your journey.
 | A guest post by
|
Thank you for sharing this knowledgable case study! One question I have here is as we deploy the feature to all clients using the free trial, so is the population should be all clients using the free trial, and the treatment is the clients who opted to use the free shipping?
Glad you found this useful, Mike! Yes, the entire target population consists of users on a free trial. The treatment group includes users who use free shipping, and instead of comparing them to the full baseline of users who don’t use free shipping, we select a matched control group of users - those who are similar but didn’t opt for free shipping.