


Part 3B: Measuring the Impact of Free Shipping: a Diff-in-Diff Case Study
Using Difference-in-Differences, we estimate the true causal impact of offering free shipping—beyond assumptions and surface-level metrics.


👋 Hey! This is Manisha Arora from PrepVector. Welcome to the Tech Growth Series, a newsletter that aims to bridge the gap between academic knowledge and practical aspects of data science. My goal is to simplify complicated data concepts, share my perspectives on the latest trends, and share my learnings from building and leading data teams.
In Part 1 of this series, we introduced the Difference-in-Differences (DiD) method - unpacking its intuition, real-world relevance, and the core assumptions that make it work.
In Part 2, we provided a step-by-step guide to implementing DiD - from structuring panel data to model specification, validation, and inference.
In Part 3A, we kicked off an industry case study and worked through Steps 1-4, which consisted of framing the problem statement, building a dataset and validating assumptions.
In this part, you’ll learn how to:
Estimate treatment effects using canonical DiD regression
Make the model robust through transformations
Run Diagnostics & Interpret Results
Let’s dive in.
Step 5: Model Specification & Estimation
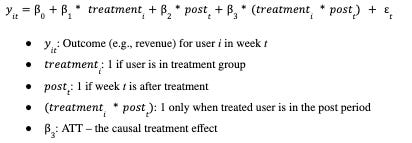
After confirming parallel trends, we now formally estimate the treatment effect using a canonical DiD regression:
Implementation
We ran a Difference-in-Differences (DiD) regression to estimate the causal impact of free shipping on user revenue. To make the model robust and interpretable, we applied the following transformations:
Log Transformation of Revenue: Revenue is often highly skewed - some users spend a lot more than others. To handle this, we used a log transformation (log(1 + revenue)), which compresses large values and allows us to interpret results as percentage changes instead of raw dollar amounts.
Treatment & Time Indicators: We created two binary flags:
treatment: Whether a user ever received free shipping.
post: Whether the observation is from after the user received free shipping.
The interaction of these two (treatment × post) is the core DiD variable - it captures the effect only for treated users in the post-treatment period.
Two-Way Fixed Effects (TWFE):
User Fixed Effects remove any stable user-specific behavior (e.g., some users are always high spenders). By adding user fixed effects, we essentially compare each user to themselves over time. This way, we focus only on how their behavior changed after treatment, not how they differ from others.
Week Fixed Effects account for broader time trends (e.g., holidays, global promotions) that affect all users in a given week. By including week fixed effects, we isolate the treatment effect from general weekly trends that would otherwise confound our results.
Together, these fixed effects ensure that the estimated treatment effect isn’t simply capturing who the user is or what was happening in a given week, but instead isolates the real behavioral change caused by the treatment itself.
Clustered Standard Errors (by user): Since we observe each user across multiple weeks, we cluster errors by user to avoid overstating significance due to repeated measurements.
Figure: Output results of DID regression
In the above output, the estimated DiD coefficient (did) is 0.5686, and the p-value is less than 0.001, which means the treatment effect is highly statistically significant - we can be very confident that this is not due to chance.
Since we applied a log transformation to revenue (to handle skewed data), the coefficient is interpreted multiplicatively. Taking the exponential of 0.5686 gives us about 1.765, which means:
“Users who received free shipping spent approximately 76.5% more on average after the treatment compared to what they would have spent without it.”
The tight confidence interval (from 0.5616 to 0.5756) shows that this estimate is precise - there’s very little uncertainty about the size of the effect.
Shameless Plugs:
Master Product Sense and AB Testing, and learn to use statistical methods to drive product growth. I focus on inculcating a problem-solving mindset, and application of data-driven strategies, including A/B Testing, ML, and Causal Inference, to drive product growth.
AI/ML Projects for Data Professionals
Gain hands-on experience and build a portfolio of industry AI/ML projects. Scope ML Projects, get stakeholder buy-in, and execute the workflow from data exploration to model deployment. You will learn to use coding best practices to solve end-to-end AI/ML Projects to showcase to the employer or clients.
A/B Testing Course for Data Scientists and Product Managers
Learn how top product data scientists frame hypotheses, pick the right metrics, and turn A/B test results into product decisions. This course combines product thinking, experimentation design, and storytelling—skills that set apart analysts who influence roadmaps.
Step 6 & Step 7: Robustness Checks & Diagnostics
Even when the DiD estimate looks promising, it's important to do a few quick sanity checks to ensure the results are credible. Here are lightweight checks we include in this analysis:
1. Visual Pre-Trend Check
We plot the average outcome over time for treatment and control groups. If the trends were roughly parallel before the free shipping intervention, it's a good sign the parallel trends assumption holds.
2. Placebo Test (Optional)
We re-run the DiD assuming a fake treatment period (e.g., one week earlier). If we see a significant effect during this placebo window, it might indicate that external factors - not the treatment - are driving the results.
3. Alternate Control Group
We check if the estimated effect holds when we swap in a different control group (e.g., users in a different region or segment). This helps ensure the results aren't overly dependent on one specific comparison.
These checks aren’t exhaustive - we’ll cover a fuller set of diagnostics and robustness strategies in the next part of this series.
Step 8 & Step 9: Inference, Interpretation & Communication
Building on the rigorous modeling and robustness checks, we now turn to Step 8: Inference & Confidence and Step 9: Interpretation & Communication. We quantified uncertainty using 95% confidence intervals and p-values derived from clustered standard errors at the user level, ensuring reliable inference despite within-user correlation. The treatment effect remained stable and statistically significant across specifications, reinforcing its robustness.
To interpret the findings, we translated the log-point increase into a ~77% revenue uplift, providing a clear and actionable business insight. We also assessed the validity of our assumptions - especially parallel trends - via placebo tests and lead-lag regressions. For communication, results were visualized and contextualized with relevant business scenarios to make them accessible to product, marketing, and strategy teams. These final steps bridge statistical rigor with stakeholder relevance, ensuring our analysis drives informed decision-making.
Want to Dive Deeper? Explore the Code
We've shared the full implementation of this analysis on GitHub — from estimating propensity scores to computing the average treatment effect.
You'll find:
Clean and modular Python code
Step-by-step comments for clarity
Visualizations of the DiD model
Final estimation of the treatment effect
Feel free to fork, experiment, or adapt it to your use cases.
Upcoming Courses:
Master Product Sense and AB Testing, and learn to use statistical methods to drive product growth. I focus on inculcating a problem-solving mindset, and application of data-driven strategies, including A/B Testing, ML, and Causal Inference, to drive product growth.
AI/ML Projects for Data Professionals
Gain hands-on experience and build a portfolio of industry AI/ML projects. Scope ML Projects, get stakeholder buy-in, and execute the workflow from data exploration to model deployment. You will learn to use coding best practices to solve end-to-end AI/ML Projects to showcase to the employer or clients.
A/B Testing Course for Data Scientists and Product Managers
Learn how top product data scientists frame hypotheses, pick the right metrics, and turn A/B test results into product decisions. This course combines product thinking, experimentation design, and storytelling—skills that set apart analysts who influence roadmaps.
Not sure which course aligns with your goals? Send me a message on LinkedIn with your background and aspirations, and I'll help you find the best fit for your journey.
 | A guest post by
|