

Part 4: Running Robustness Checks in Diff-in-Diff
In this post, we walk through key robustness checks—from outlier analysis to placebo tests and diagnostics—to ensure your causal claims stand on solid ground.


👋 Hey! This is Manisha Arora from PrepVector. Welcome to the Tech Growth Series, a newsletter that aims to bridge the gap between academic knowledge and practical aspects of data science. My goal is to simplify complicated data concepts, share my perspectives on the latest trends, and share my learnings from building and leading data teams.
In Part 1 of this series, we introduced the Difference-in-Differences (DiD) method - unpacking its intuition, real-world relevance, and the core assumptions that make it work.
In Part 2, we provided a step-by-step guide to implementing DiD - from structuring panel data to model specification, validation, and inference.
In Part 3A and Part 3B, we implemented the methodology on an industry case study.
Before you ship your insights to a stakeholder or embed them into a product decision, you need to stress-test your results. In this blog, we’ll walk through how to:
Run robustness checks through outlier analysis, alternate control groups, varying time windows, and more.
Perform diagnostics checks to assess fit and interpret results
Let’s dive in.
Robustness Checks
1. Exclude Extreme Outliers
To check whether a few unusually high-revenue users were driving our results, we filtered out the top 1% of user-week revenue observations. These extreme values could come from rare, one-off shopping events and may not reflect typical user behavior. After removing them, we re-estimated the treatment effect using the same Difference-in-Differences model, keeping the structure of user and time fixed effects and clustered standard errors.
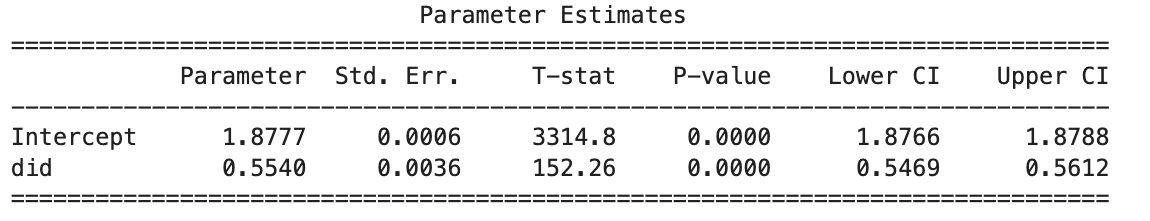
After excluding the most extreme spenders, the treatment effect remained strong and statistically significant. The new estimate suggests that free shipping led to an average revenue increase of about 74%. This is slightly lower than the earlier estimate but still substantial. The tight confidence interval shows the estimate is precise. Overall, this confirms that the observed uplift is not just due to a few high-spending users, but is a consistent pattern across the broader population.
2. Placebo Tests (Fake Treatments)
To validate the causal inference from our Difference-in-Differences (DiD) model, we conducted a placebo test - a standard robustness check used to ensure that the estimated treatment effect is not driven by unrelated time trends or random noise. This is done by pretending the treatment happened before the actual intervention and checking whether the model still reports a significant effect. If it does, it casts doubt on the causal validity of the original estimate.
Specifically, we selected a pre-treatment week and constructed a fake treatment indicator (placebo_did), defined as the interaction between the treatment group and a placebo post-treatment period. We then reran the DiD regression using this placebo indicator while keeping the model specification unchanged: fixed effects for users and time, and clustered standard errors at the user level.
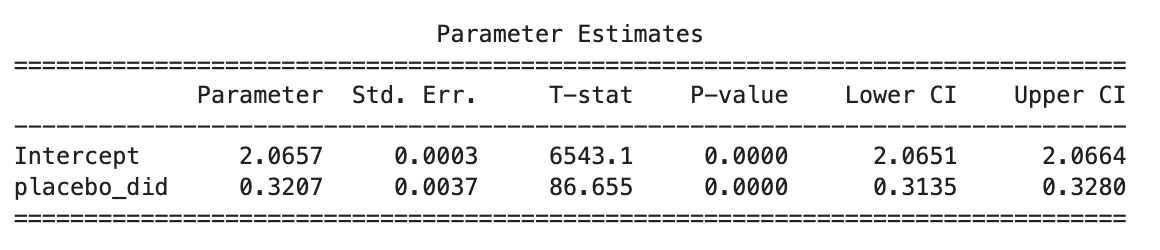
The placebo regression yielded a statistically significant effect with a coefficient of 0.3207 (p < 0.001), despite no real treatment being applied during this period. This outcome suggests that the model may be partially sensitive to underlying temporal patterns or unobserved confounding factors, even in the absence of the actual intervention. While this does not invalidate the original DiD findings - especially given that other robustness checks, including lead-lag event studies and outlier exclusions, demonstrated consistent and plausible treatment effects - it does underscore the importance of careful model interpretation. The placebo result highlights the potential for residual bias and motivates further exploration of alternative specifications or control strategies to reinforce causal validity.
3. Try Alternative Control Groups
To validate that the observed treatment effect is not overly dependent on the specific control group selected, we re-ran the Difference-in-Differences (DiD) regression using an alternative set of control users. Since random assignment wasn’t feasible, we constructed the alternative control group heuristically: from untreated users with even user IDs (user_id % 2 == 0). This ensured that the comparison group differed from the original one while still representing similar engagement levels. We filtered the dataset to include both treated users and this new control group. Then, we re-estimated the DiD model, including user and time fixed effects, and clustered standard errors at the user level to account for within-user correlation.
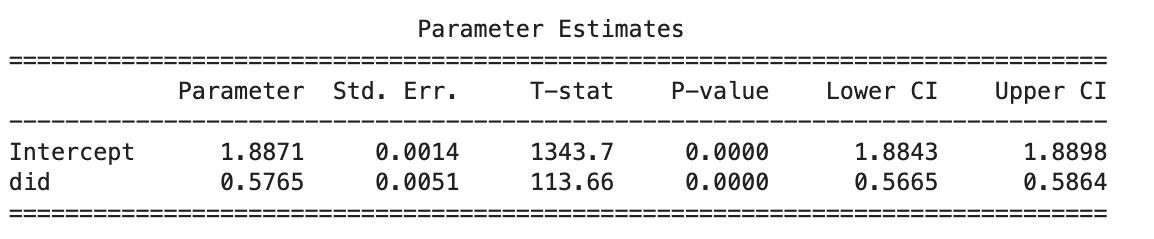
The regression produced a DiD coefficient of 0.5765, with a tight 95% confidence interval [0.5665, 0.5864] and a p-value < 0.001, indicating a highly statistically significant effect. This result is very similar to the original estimate (0.5686), which strengthens confidence in the causal interpretation. The effect appears robust across different control group definitions, reducing concerns that the treatment effect is being driven by group-specific characteristics or model specification quirks. This check increases the external validity of the findings and confirms that the observed uplift is not sensitive to control group selection.
Shameless Plugs:
Master Product Sense and AB Testing, and learn to use statistical methods to drive product growth. I focus on inculcating a problem-solving mindset, and application of data-driven strategies, including A/B Testing, ML, and Causal Inference, to drive product growth.
AI/ML Projects for Data Professionals
Gain hands-on experience and build a portfolio of industry AI/ML projects. Scope ML Projects, get stakeholder buy-in, and execute the workflow from data exploration to model deployment. You will learn to use coding best practices to solve end-to-end AI/ML Projects to showcase to the employer or clients.
A/B Testing Course for Data Scientists and Product Managers
Learn how top product data scientists frame hypotheses, pick the right metrics, and turn A/B test results into product decisions. This course combines product thinking, experimentation design, and storytelling—skills that set apart analysts who influence roadmaps.
4. Vary the Pre/Post Time Window
To test whether our estimated treatment effect is sensitive to the chosen time window, we conducted a robustness analysis using two alternative pre/post windows: 2 weeks before and after the treatment, and 4 weeks before and after. We subsetted the panel dataset (panel_df) to include only observations falling within these defined windows relative to each user’s treatment week. For each subset, we reran the fixed effects DiD regression with user and time fixed effects, and clustered standard errors by user.
Figure 2-week pre/post window results
Figure 4-week pre/post window results
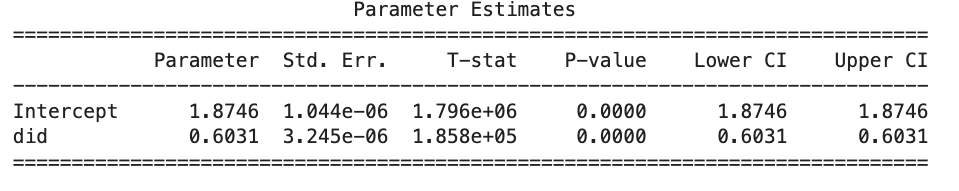
Both regressions yielded strongly significant treatment effects. In the 2-week window, the did coefficient was 0.6029 with a p-value less than 0.001. Similarly, in the 4-week window, the did coefficient was 0.6031, also highly significant with a p-value below 0.001. The near-identical coefficients across both time horizons indicate that our estimated treatment effect is stable across reasonable variations in the pre/post window length. This consistency suggests that the observed uplift in log-revenue is not merely a result of an arbitrary time frame selection, but rather reflects a reliable and genuine treatment effect. As a result, this robustness check further reinforces the validity of our causal interpretation.
5. Sensitivity Analysis on Covariates
To evaluate whether our treatment effect estimate is sensitive to model specification, we conducted a covariate sensitivity analysis. This involved re-estimating the DiD model while sequentially introducing additional covariates, including session_activity and annual_purchase_value.
We estimated three model specifications:
Baseline: Includes only the treatment indicator (did) and fixed effects.
session_activity: Adds user-level session activity as a covariate.
session_activity + annual_purchase_value: Adds both covariates.
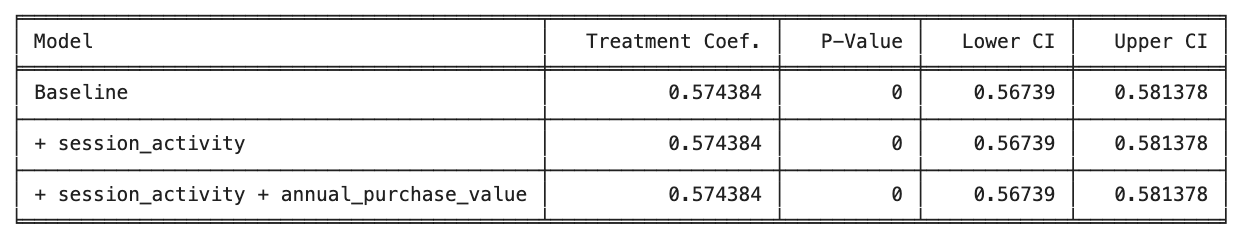
Interestingly, both covariates were absorbed by the fixed effects, meaning they did not contribute any independent variation beyond what was already captured by user and time fixed effects. Consequently, the treatment coefficient (did) remained exactly stable across all three specifications: Treatment Coefficient: 0.574 (p < 0.001), 95% CI: [0.567, 0.581]
This indicates that our causal estimates are not sensitive to the inclusion of these covariates, further reinforcing the robustness of the main treatment effect. The fixed effects already account for much of the cross-sectional and temporal variation, reducing the need for additional control variables.
Diagnostics & Fit Validation
To ensure the validity of our DiD model, we conducted several diagnostic checks. First, we examined a residual plot by plotting the residuals against the fitted values from the baseline model. This visual inspection did not reveal any obvious patterns or trends, suggesting that the model is reasonably well specified and that no critical non-linearities or omitted variables are distorting the estimates. The residuals appeared randomly scattered around zero, which is the expected behavior under a well-fitting linear model.
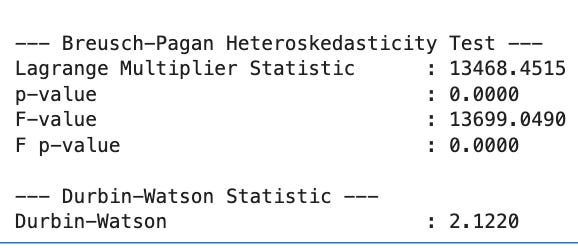
Next, we ran the Breusch-Pagan test to check for heteroskedasticity, i.e., whether the variance of the error terms is constant across observations. The test returned a highly significant p-value (p < 0.0001), indicating the presence of heteroskedasticity. This confirms that our use of clustered standard errors - an approach robust to such issues - was appropriate and necessary for valid inference.
We also computed the Durbin-Watson statistic to assess potential autocorrelation in the residuals, which is especially relevant in panel data settings where observations are repeated over time. The statistic was approximately 2.12, which is close to the ideal value of 2, suggesting that there is no meaningful autocorrelation present.
Overall, the diagnostic checks reinforce the robustness of our model specification and estimation strategy. The treatment effect estimates can be interpreted with greater confidence, knowing that common sources of statistical bias - such as heteroskedasticity and autocorrelation - have been accounted for appropriately.
Closing Thoughts
Robustness checks aren’t optional. They’re what separates exploratory analysis from credible causal inference.
If you’re presenting DiD results to your stakeholders, expect to be asked:
“What makes you sure this is real?”
This blog gives you the tools to answer that with confidence.
This concludes our series on Difference-in-Differences. We started with the intuition behind DiD, walked through how to implement it, applied it to a real-world case, and ended with tools to stress-test your results. Whether you're analyzing product features, policy rollouts, or business experiments, DiD can be a powerful technique - when used thoughtfully. I hope this series has helped demystify it and given you a framework you can rely on in your own work. If you found this valuable, share it with your team or other data professionals.
Upcoming Courses:
Master Product Sense and AB Testing, and learn to use statistical methods to drive product growth. I focus on inculcating a problem-solving mindset, and application of data-driven strategies, including A/B Testing, ML, and Causal Inference, to drive product growth.
AI/ML Projects for Data Professionals
Gain hands-on experience and build a portfolio of industry AI/ML projects. Scope ML Projects, get stakeholder buy-in, and execute the workflow from data exploration to model deployment. You will learn to use coding best practices to solve end-to-end AI/ML Projects to showcase to the employer or clients.
A/B Testing Course for Data Scientists and Product Managers
Learn how top product data scientists frame hypotheses, pick the right metrics, and turn A/B test results into product decisions. This course combines product thinking, experimentation design, and storytelling—skills that set apart analysts who influence roadmaps.
Not sure which course aligns with your goals? Send me a message on LinkedIn with your background and aspirations, and I'll help you find the best fit for your journey.
 | A guest post by
|